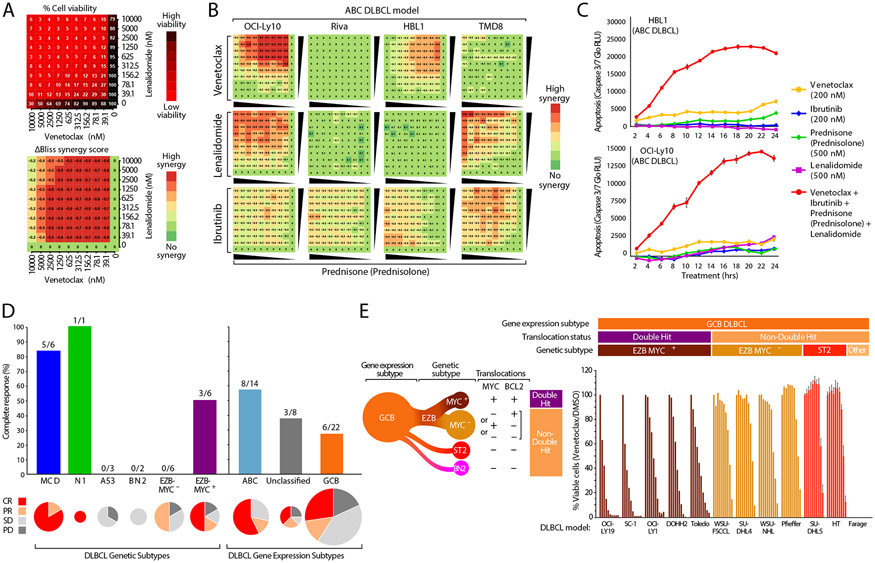
Figure 3: Molecular Correlates of ViPOR Response.
A). The response to combinations of venetoclax and lenalidomide in a 10 × 10 matrix for the OCI-Ly10 ABC DLBCL cell line using normalized cell viability (top) or the calculated ΔBliss synergy score (bottom); B). Heatmaps displaying the calculated ΔBliss synergy score for each combination of indicated ViPOR drug doublets in four ABC DLBCL cell lines in a 10 × 10 matrix; C). Relative luminescence units (RLU) are displayed for cleaved caspase 3/7 measured in the indicated ABC DLBCL cell lines in culture with ViPOR agents singly or in combination for 2 to 24 hours; D). The complete response rate of ViPOR-treated patients is displayed for tumor biopsy grouped by LymphGen genetic subtype (left), or by cell-of-origin gene expression-assigned subtype (right). Pie charts are scaled to the total number of biopsies assigned to each subtype and display the percent of patients with complete response (CR), partial response (PR), stable disease (SD), or progressive disease (PD); E). Normalized cell viability of indicated GCB DLBCL cell lines treated with dilutions of the BCL2 inhibitor venetoclax (0.01-10.0uM). Assignment of GCB cell lines to LymphGen genetic subtypes is indicated. The EZB subtype can by further subdivided into EZB-MYC+ with both MYC and BCL2 translocations and EZB-MYC− that has only one or neither of these translocations.

