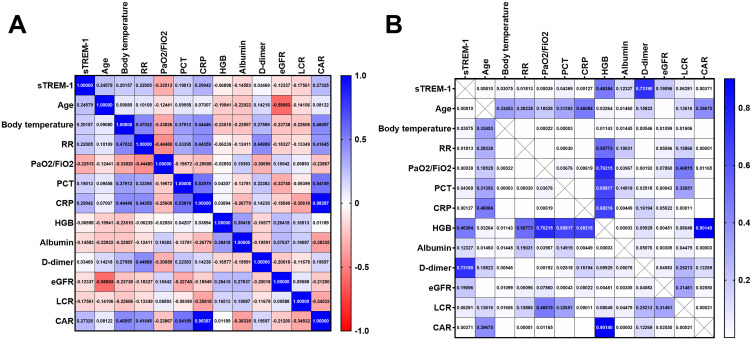
Figure 3.
Heatmap depicting the correlation between sTREM-1 and age, Vital signs, and laboratory inflammatory markers. (A) The values are presented as Spearman‘s correlation coefficient (r) for a sample of 115 runners regarding sTREM-1. The colormap ranges from 1 to −1, with blue indicating the highest value and red indicating the lowest value. (B) The Heatmap of corresponding p-values. The colormap ranges from 0 to 1, with blue representing the largest value and white representing the smallest value. White cells without numerical values indicate that the p-value is smaller than 0.00001, indicating a highly significant correlation.
Abbreviations: RR, respiratory rate; PaO2, oxygen tension; FiO2, fraction of inspired oxygen; sTREM, soluble Triggering Receptors Expressed on Myeloid Cell; PCT, Procalcitonin; CRP, C-reactive protein; HGB, Hemoglobin; eGFR, estimated glomerular filtration rate; LCR, Lymphocyte-to- C-reactive protein ratio; CAR, C-reactive protein-to-albumin ratio.

