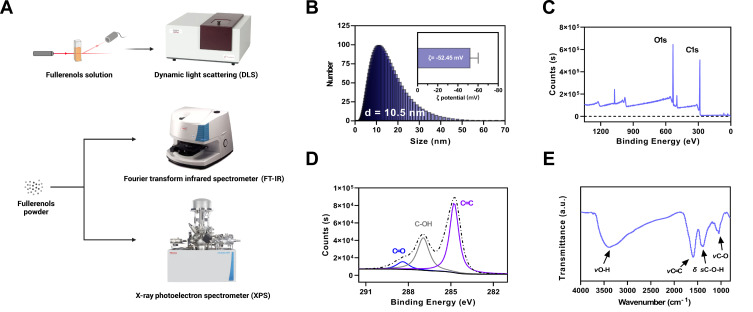
Figure 1.
Characterization of fullerenols. (A) Schematic diagram of the fullerenols characterization and detection process. (B) Hydrodynamic size distribution and ζ potential of fullerenols. (C) XPS is scanning the spectrum of fullerenols. (D) XPS C1s are scanning the spectrum of fullerenols. (E) FT-IR spectrum of fullerenols.

