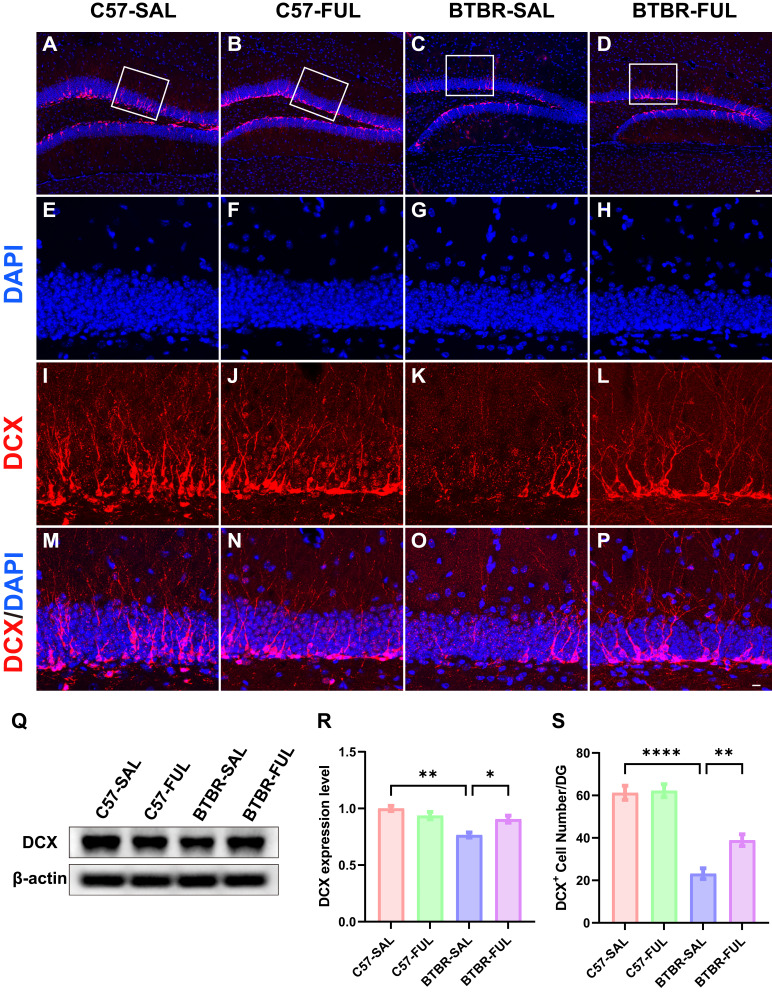
Figure 6.
Fullerenols treatment increased the DCX+ cells in the DG and DCX protein levels in the hippocampus of BTBR mice. (A-D) Representative images of DCX-positive cells in the DG of four groups of mice. (E-P) Immunolabeled DCX (red), DAPI (blue), and DCX+/DAPI+ images at high magnification. (Q) Representative Western blotting of DCX in mouse hippocampus in each group. (R) Quantification of DCX protein level in the hippocampus. (S) Quantification of the number of DCX+ cells in the DG. The number of DCX+ cells in the DG and protein expression in the hippocampus of BTBR mice were significantly lower than those in C57 mice, which were rescued by fullerenols intervention. Data are presented as mean ± SEM. N = 3–5. The scale bar = 20 μm is shown in Figure D and applied to A-D. The scale bar = 10 μm is shown in Figure P and applied to E-P. *P < 0.05, **P < 0.01, ****P < 0.0001.

