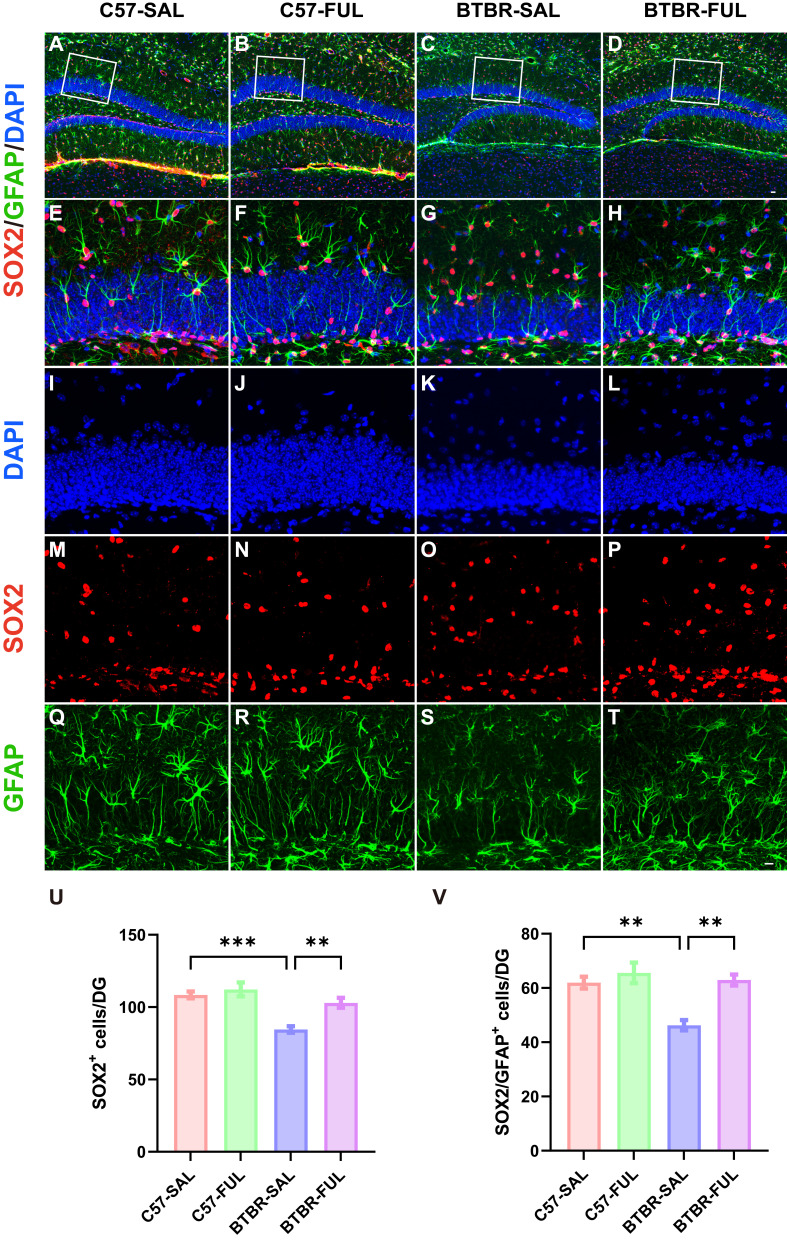
Figure 7.
Fullerenols treatment restored the NPC pool in the DG of the BTBR mouse. (A–D) Representative images of SOX2+/GFAP+ double-positive NPCs in the DG of four groups of mice. (E–H) High-magnification of the selected area. (I–T) Immunostaining of DAPI (blue), SOX2 (red), and GFAP (green). (U) Quantification of the number of SOX2+ cells in the DG. (V) Quantification of SOX2+/GFAP+ cells in the DG. Data are presented as mean ± SEM. N = 5. The scale bar = 20 μm is shown in Figure D and applied to (A–D). The scale bar = 10 μm is shown in Figure T and applied to (E–T). **P < 0.01, ***P < 0.001.

