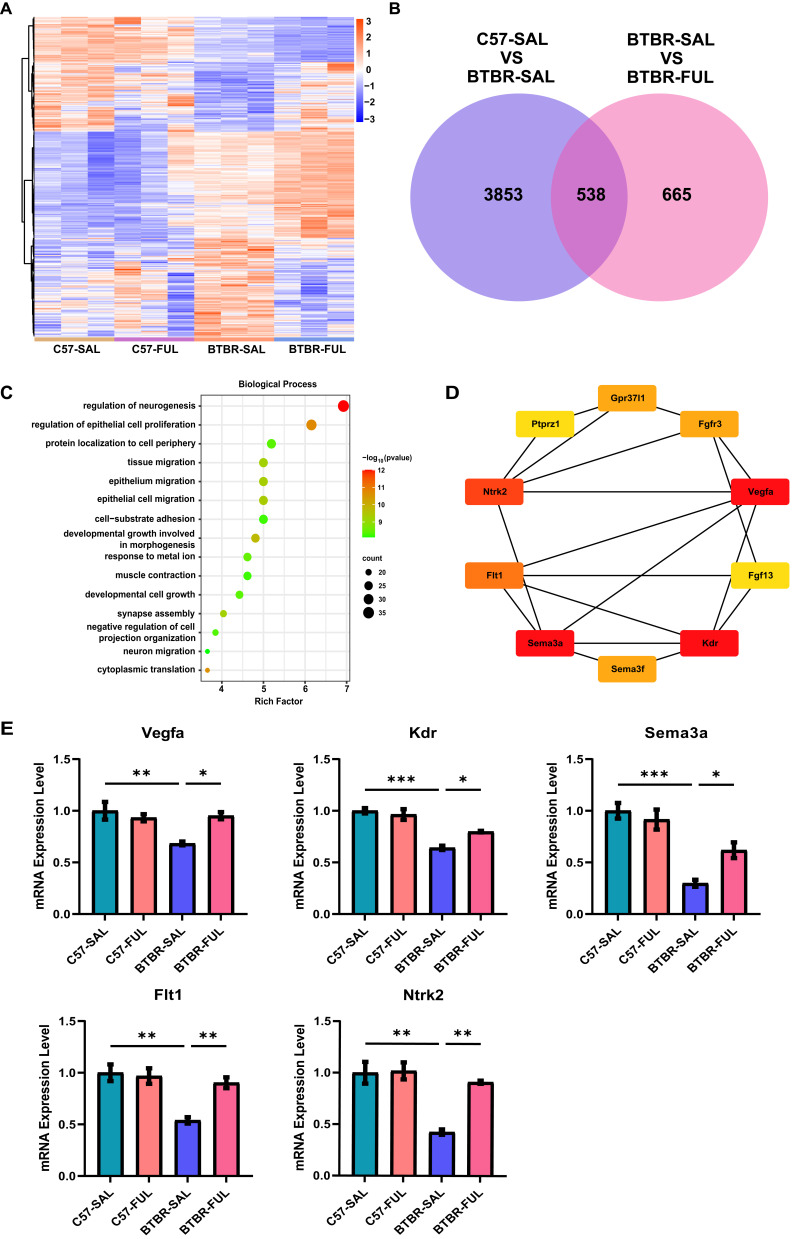
Figure 8.
Fullerenols altered the hippocampus transcriptome in four groups of mice. (A) Hierarchical clustering gene expression heatmap of the four groups of mice. (B) Venn diagram for the treatment of co-regulated DEGs by fullerenols. (C) The top 15 GO pathways in BP enrichment. (D) HUB genes in neurogenesis regulatory pathways. (E) RT-qPCR verification of HUB genes in the regulatory pathways of neurogenesis (Vegfa: genotype effect: F (1, 8) = 8.740, P = 0.0182; drug effect: F (1, 8) = 4.033, P = 0.0795; genotype × drug interaction effect: F (1, 8) = 11.23, P = 0.0101. Sema3a: genotype effect: F (1, 12) = 44.98, P < 0.0001; drug effect: F (1, 12) = 2.494, P = 0.1403; genotype × drug interaction effect: F (1, 12) = 7.387, P = 0.0187. Kdr: genotype effect: F (1, 8) = 70.41, P < 0.0001; drug effect: F (1, 8) = 3.682, P = 0.0913; genotype × drug interaction effect: F (1, 8) = 9.470, P = 0.0152. Flt1: genotype effect: F (1, 12) = 17.61, P = 0.0012; drug effect: F (1, 12) = 7.021, P = 0.0212; genotype × drug interaction effect: F (1, 12) = 9.987, P = 0.0082. Ntrk2: genotype effect: F (1, 8) = 24.72, P = 0.0011; drug effect: F (1, 8) = 13.56, P = 0.0062; genotype × drug interaction effect: F (1, 8) = 11.56, P = 0.0094), the data are presented as mean ± SEM, N = 3–4, *P < 0.05, **P < 0.01, ***P < 0.001.

