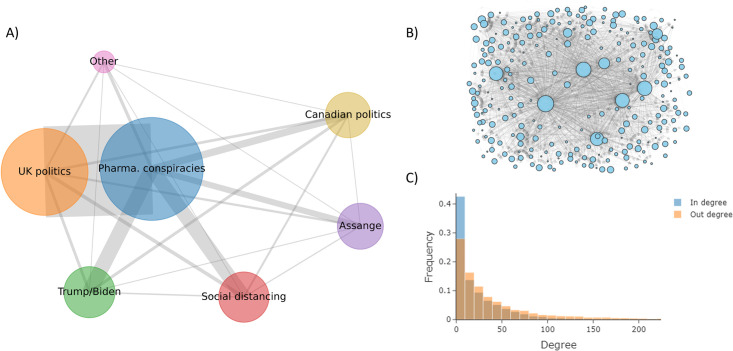
Fig 1. Base network characterization.
(A) Network diagram of our base social media network. Node size is proportional to community population number, and edge thickness is proportional to the number of user edges between two community nodes. The labels are extracted by applying topic modeling to recorded tweet history within each community. (B) A directed network diagram for a sample of users within the ‘Assange’ community where each node represents a user within the community, node size is proportional to follower count, and edge transparency is proportional to node out-degree (C) The in-degree and out-degree distribution of our base network.

