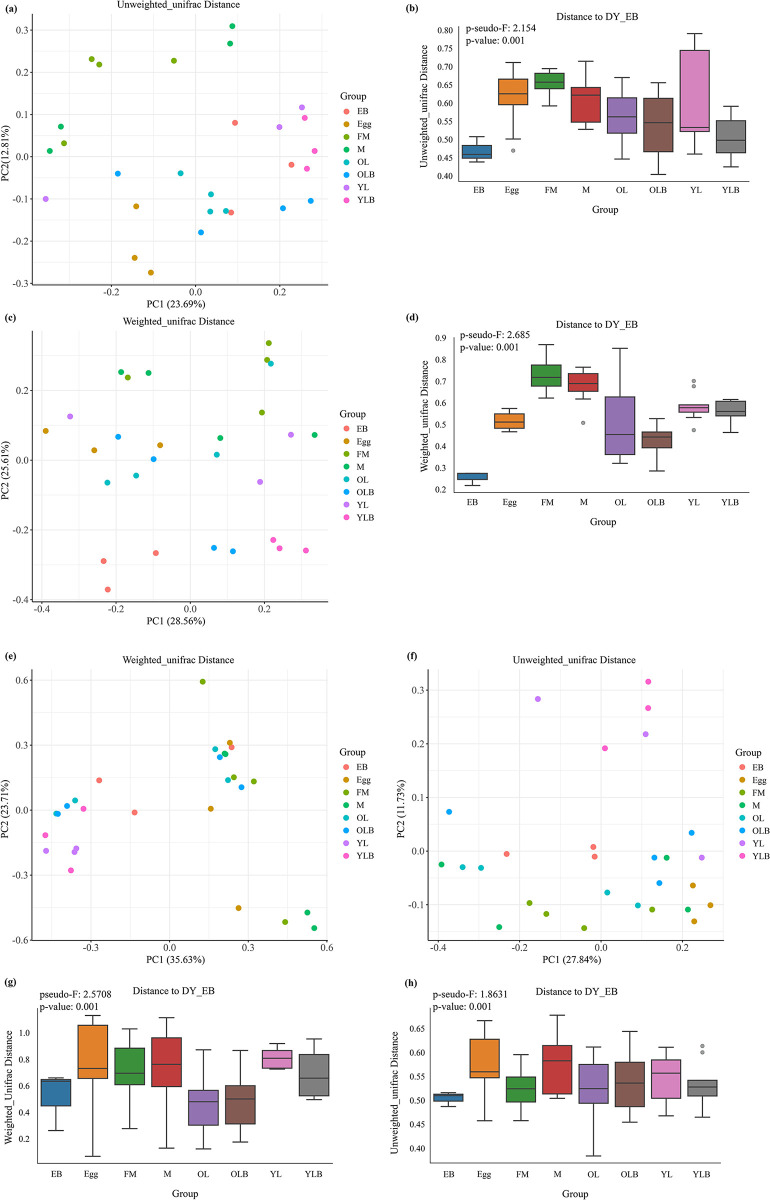
Fig 6. Analysis of β-diversity in the gut microbial communities of C. molossus at different developmental stages and their brood balls.
PERMANOVA (Permutational Multivariate Analysis of Variance) is used to detect differences between different groups. (a) PCoA plot based on the Unweighted Unifrac distance matrix, where each symbol represents the bacterial community of a sample, and colors indicate different groups; (b) PERMANOVA test for bacterial community diversity across different groups based on the Unweighted Unifrac distance matrix, pseudo-F = 2.154, p-value = 0.001; (c) PCoA plot based on the Weighted Unifrac distance matrix, where each symbol represents the bacterial community of a sample, and colors indicate different groups; (d) PERMANOVA test for bacterial community diversity across different groups based on the Weighted Unifrac distance matrix, pseudo-F = 2.685, p-value = 0.001; (e) PCoA plot based on the Weighted Unifrac distance matrix, where each symbol represents the fungal community of a sample, and colors indicate different groups; (f) PCoA plot based on the Unweighted Unifrac distance matrix, where each symbol represents the fungal community of a sample, and colors indicate different groups; (g) PERMANOVA test for bacterial community diversity across different groups based on the Weighted Unifrac distance matrix, pseudo-F = 2.5708, p-value = 0.001; (h) PERMANOVA test for bacterial community diversity across different groups based on the Unweighted Unifrac distance matrix, pseudo-F = 1.8631, p-value = 0.001.

