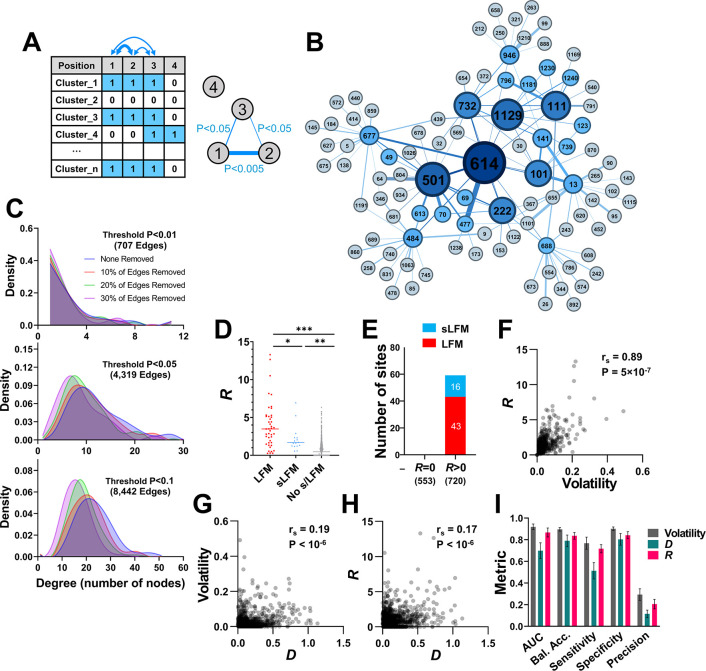
Fig 4. High volatility at co-variable sites is associated with emergence of LFMs and sLFMs.
(A) Schematic of the approach to generate the co-variability network of spike. For all positions, the absence (0) or presence (1) of amino acid variability was determined in each cluster of 50 sequences. The co-occurrence of variability at all position pairs was calculated using Fisher’s test, and the P-values were used to construct the network. (B) The co-variability network around position 614 as the root node. Edges were assigned if P-values were smaller than 0.05. First- and second-degree nodes are shown. Node size corresponds to the number of triangle counts for each position. (C) Network robustness. Networks were constructed using P-value thresholds of <0.01, <0.05 or <0.1. For each network, we randomly deleted 10%, 20% or 30% of edges and examined the effect on network stability. The degree distribution (i.e., the number of nodes associated with each position) is shown for the intact and depleted networks. (D) R values describe for each position the total weighted volatility at network-associated positions. R values for spike positions that emerged with LFMs, sLFMs or with no such mutations are shown. (E) Number of LFMs and sLFMs that emerged at spike positions when R in the BL group was equal to zero or greater than zero. (F-H) Correlations between volatility, D and R values. rs, Spearman coefficient. P-value, two-tailed test. (I) Classification metrics for evaluating performance of volatility, D and R values to predict presence of s/LFMs using univariate logistic regression. Error bars, standard errors of the means for five-fold cross-validation. Bal. Acc., Balanced Accuracy.

