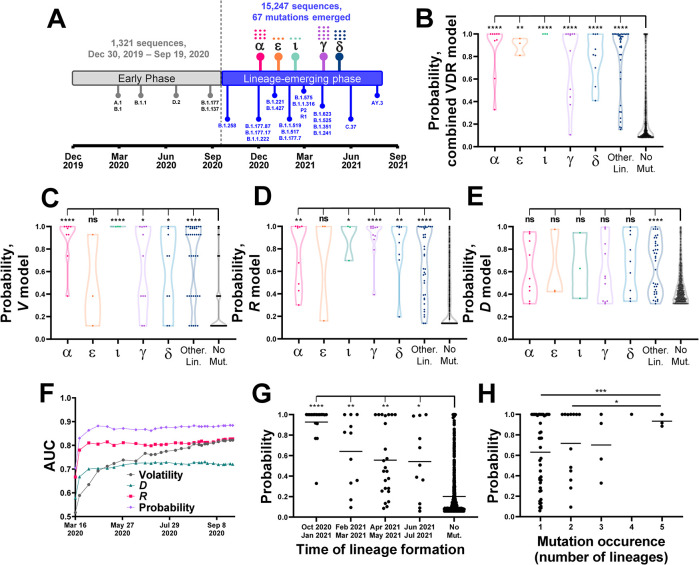
Fig 5. Volatility patterns among early-pandemic isolates predict emergence of mutations during the lineage-emerging phase.
(A) Timeline for emergence of SARS-CoV-2 lineages until July 2021. Lineage emergence time is determined by the date on which 26 sequences that contain all the lineage-defining mutations were identified. Lineages with WHO variant designations are indicated by their symbols (see S2 Table) and the number of mutations in each is shown by dots. (B) Volatility, D and R values were calculated for all spike positions using the early phase sequences and applied to a logistic regression model to predict emergence of the lineage-defining mutations. Datapoints describe probabilities assigned to all spike positions and are grouped by the lineage in which they emerged. Values are compared between the mutation sites in the indicated VOCs (or minor lineages, labeled “Other Lin.”) and the no-mutation sites (“No mut”) using an unpaired T test. (C-E) Volatility, D or R values for all spike positions were analyzed using a univariate logistic regression model. Probability values of all sites are compared between lineages, as described above. (F) Volatility, D and R values and the combined probability were calculated using different amounts of time-indexed sequences from the early phase (at 50-sequence increments). AUC values are shown for predicting emergence of the 67 lineage-defining mutations in the lineage-emerging phase. (G) The 67 sites of mutation were grouped by the emergence time of the first lineage that contains them. Mutation probabilities assigned to the sites by sequences collected until April 1st 2020 are compared with the probabilities assigned to the no-mutation sites. (H) Probabilities assigned by the April 1st 2020 dataset are shown for mutation sites that appeared in one or more lineages. Values are compared between all groups using an unpaired T test.

