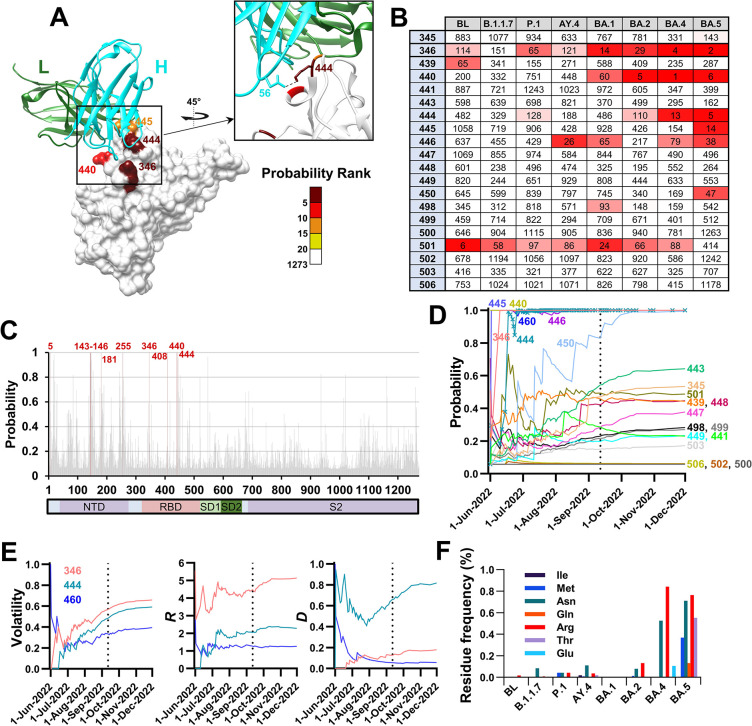
Fig 7. Mutations that conferred resistance to Bebtelovimab in subvariants BQ.1/BQ.1.1 are predicted well by volatility patterns in the parental BA.5 lineage.
(A) Mutation probabilities were calculated for all positions of spike using the baseline sequences of BA.5. Residues on the structure of the RBD in complex with Bebtelovimab (PDB ID 7MMO) are colored by their probability ranks as indicated. Ranking is relative to all 1273 positions of spike whereby lower numbers indicate higher probabilities for mutations. The heavy (H) and light (L) chains are shown. (B) Probability ranks at the contact sites of Bebtelovimab, as calculated using the baseline sequences of the indicated lineages. (C) Probability values calculated for all positions of spike using the BA.5 baseline sequences. Positions with a probability value of 0.99 or greater are highlighted in red. (D) Sequences from the BA.5 baseline were indexed by their date of collection, divided into 50-sequence clusters, and mutation probability values were calculated for groups of increasing cluster numbers. Values are shown for the Bebtelovimab contact sites. A vertical dashed line indicates the collection date of the first BQ.1 sequence. (E) Changes in values of the volatility-based variables for the three sites of mutation that define subvariants BQ.1/BQ.1.1. (F) Frequency of minority variants at position 444, expressed as a percent of all sequences in the baseline groups of the indicated lineages.

