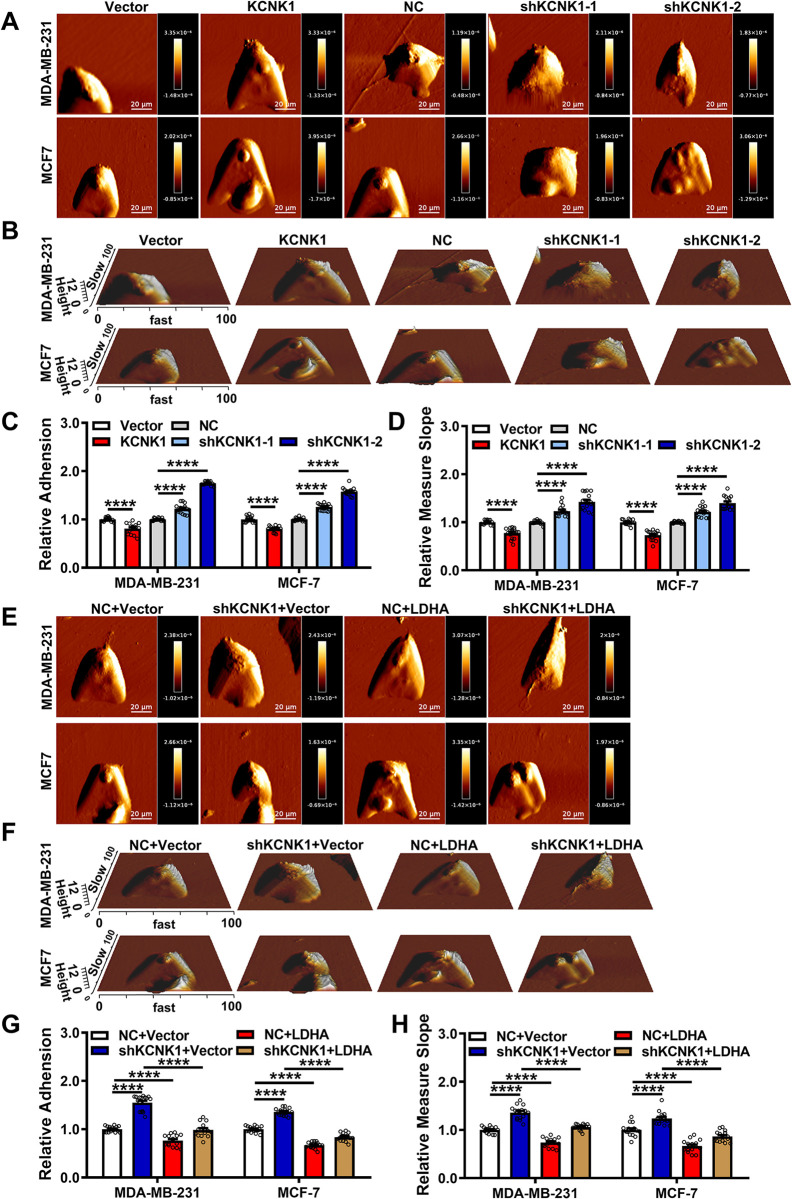
Fig 6. KCNK1 reduces the stiffness and adhesion of breast cancer cells.
(A, B) Representative AFM deflection images (A) and 3D height distribution maps (B) of MDA-MB-231 cells and MCF-7 cells in the control group, KCNK1 overexpression group, and KCNK1 knockdown group. Cells were fixed in a petri dish and were selected randomly for AFM detection. (C, D) The adhesion (C) and stiffness (D) of the scanned cells in the control group, KCNK1 overexpression group, and KCNK1 knockdown group were statistically analyzed and plotted based on the JPK image processing score. Overexpression of KCNK1 decreased the adhesion and stiffness of breast cancer cells, and knockdown of KCNK1 increased the adhesion and stiffness of breast cancer cells. (E, F) Representative AFM deflection images (E) and 3D height distribution maps (F) of MDA-MB-231 cells and MCF-7 cells in the control group, KCNK1 knockdown group, LDHA overexpression group, and co-transfection of shKCNK1 and LDHA overexpression vectors group. The cells of each group were fixed in a Petri dish and were selected randomly for AFM detection. (G, H) The adhesion (G) and stiffness (H) of scanned cells in the control group, KCNK1 knockdown group, LDHA overexpression group, and co-transfection of shKCNK1 and LDHA overexpression vectors group were statistically analyzed and plotted based on JPK image processing score. Data are presented as mean ± SD, analyzed by unpaired two-sided t tests. Source data are provided as S1 Data. AFM, atomic force microscopy; LDHA, lactate dehydrogenase A.

