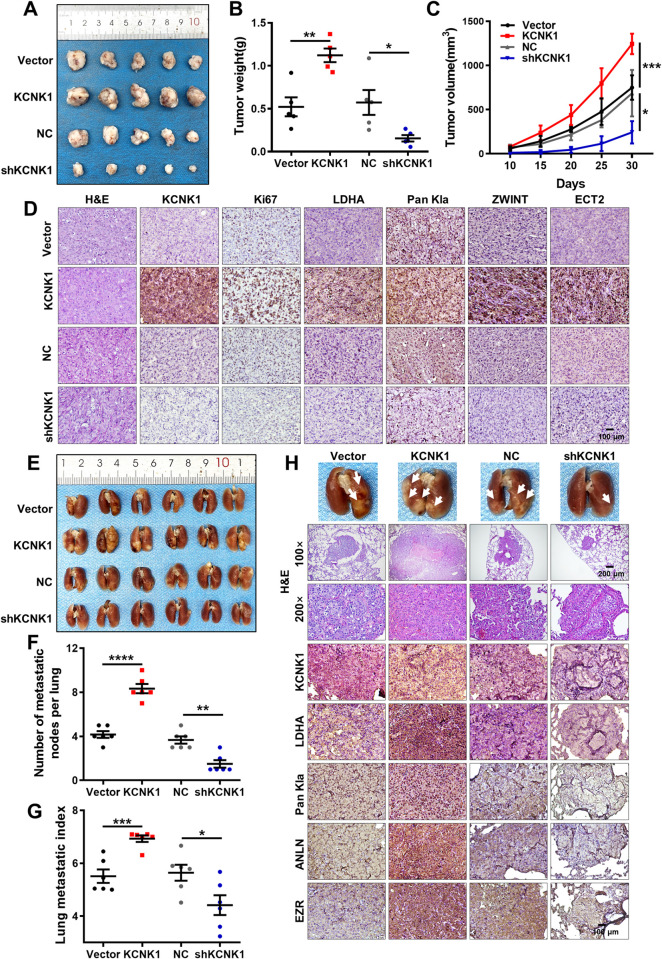
Fig 7. KCNK1 promotes breast cancer cells growth and metastasis in vivo.
(A) Images of subcutaneous tumors in nude mice. Mice were injected with 2 × 10⁶ MDA-MB-231 cells after knockdown or overexpression of KCNK1. (B, C) Tumor volumes (B) and tumor weights (C) were measured for each group (n = 5 per group). Data were represented as mean ± SD. (D) Representative images of the expression of KCNK1, Ki67, LDHA, Pan Kla, ZWINT, and ECT2 expression in subcutaneous tumors by immunohistochemistry (200× , scale bar: 100 μm). (E) Image of visible nodules on the lung surface. (F) The number of lung metastatic nodules on each lung surface was quantified. Data were represented as mean ± SD (each point represents 1 mouse; n = 6 per group). (G) The lung metastasis index was quantified for each mice. Data are expressed as mean ± SD (each point represents 1 mouse; n = 6 per group). (H) Image of visible nodules on the lung surface and representative images of KCNK1, LDHA, Pan Kla, ANLN, and EZR expression in lung nodules by immunohistochemistry (100× , scale bar: 200 μm; 200× , scale bar: 100 μm). Unpaired two-sided t tests were used to analyze the data. Source data are provided as S1 Data. LDHA, lactate dehydrogenase A.

