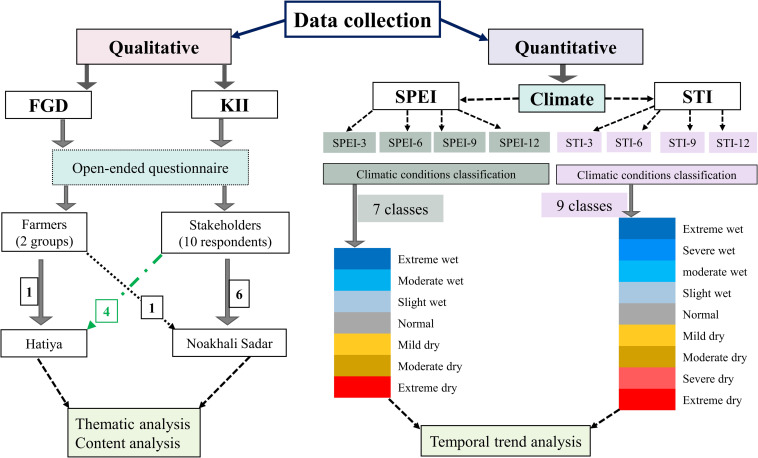
Fig 2. Flowchart illustrating the data collection (qualitative and quantitative), processing, and analysis.
Qualitative data was obtained by conducting Focus Group Discussions (FGDs) and Key Informant Interviews (KIIs). Quantitative data includes Standardized Precipitation Evapotranspiration Index (SPEI) and Standardized Terrestrial Water Storage Index (STI) values.

