Fig. 9.

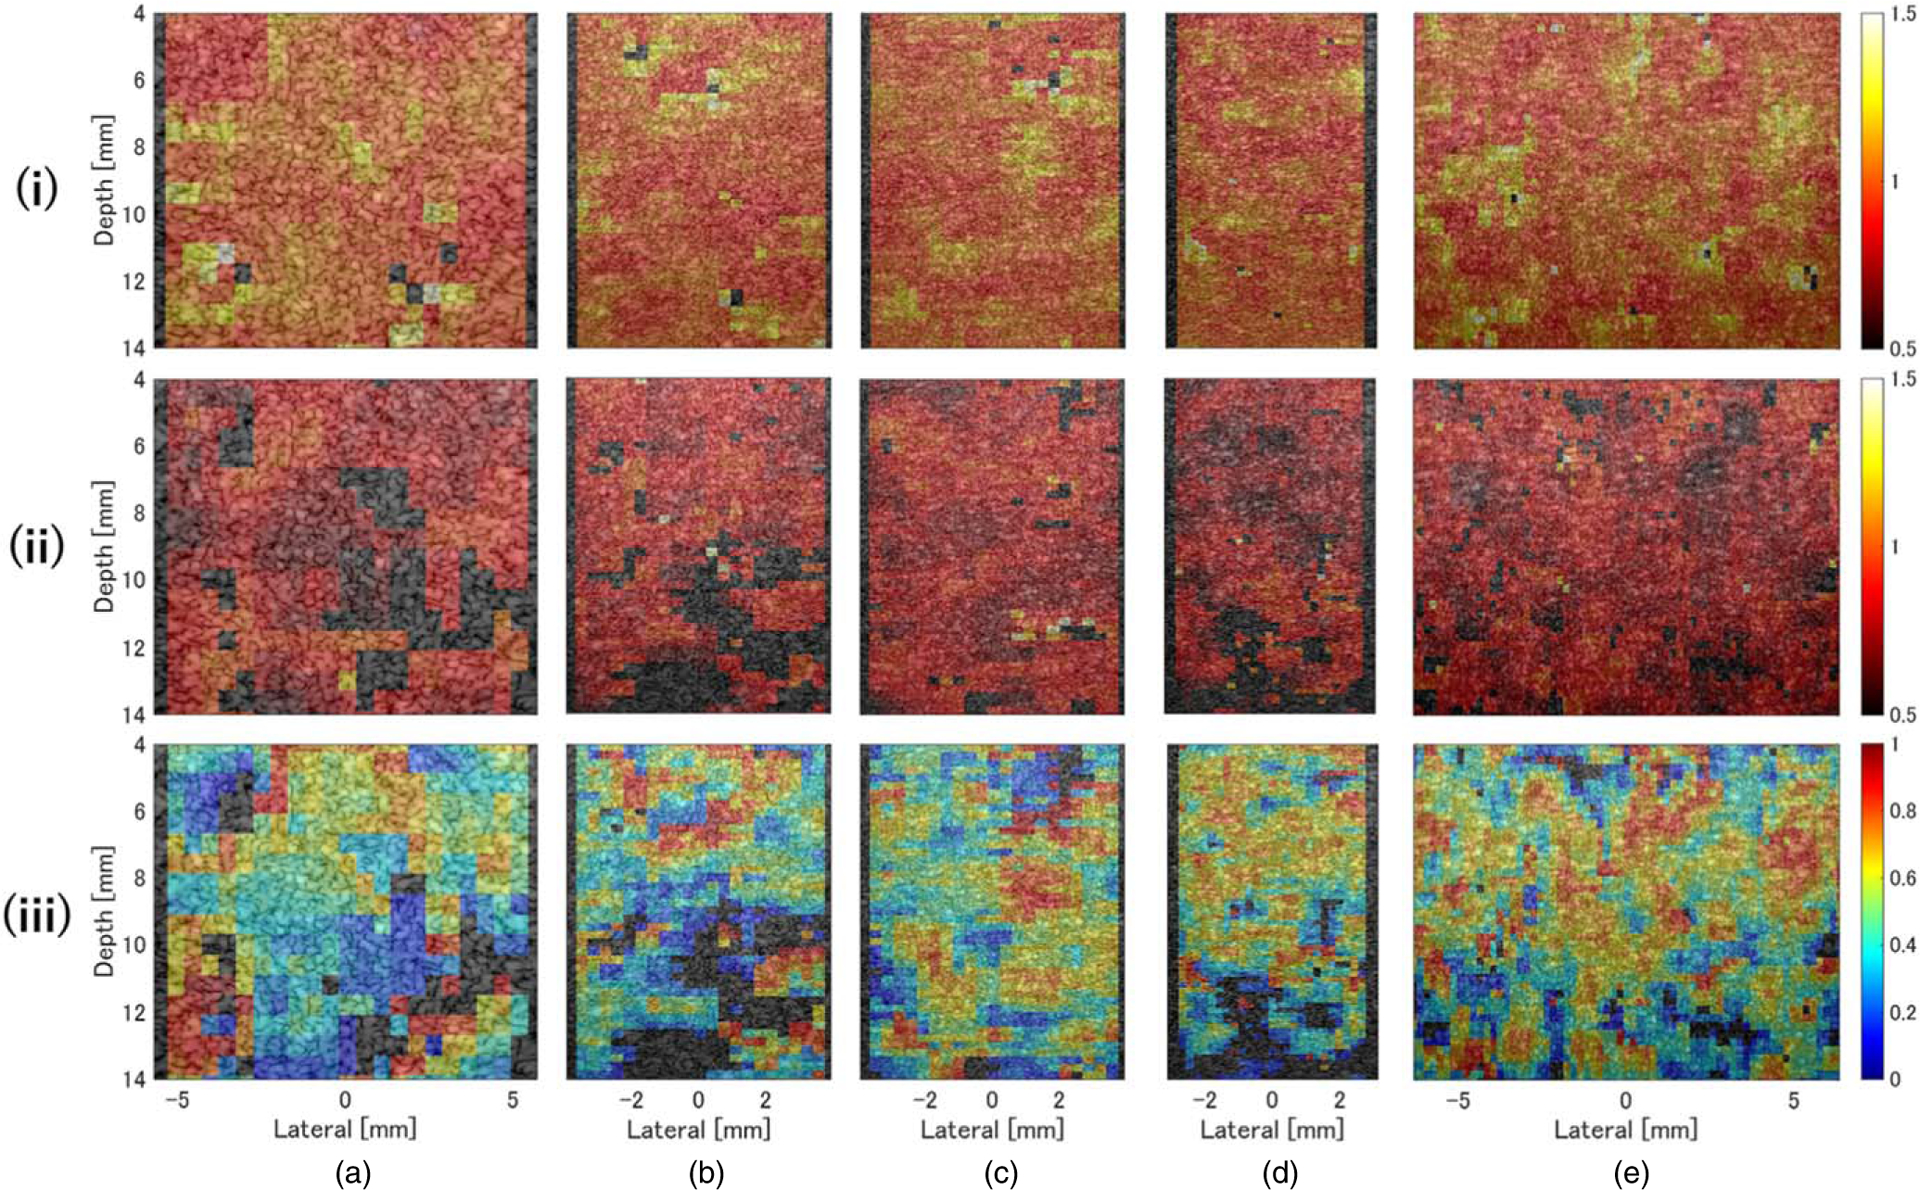
Color density plots of (i) μL, (ii) μF, (iii) and αωF for the fatty liver phantom D, overlaid on the ultrasound image. The measurement probes were (a) L22–14v, (b) L35–16vX, (c) L38–22v, (d) L39–21gD, and (e) MS550D.

Color density plots of (i) μL, (ii) μF, (iii) and αωF for the fatty liver phantom D, overlaid on the ultrasound image. The measurement probes were (a) L22–14v, (b) L35–16vX, (c) L38–22v, (d) L39–21gD, and (e) MS550D.