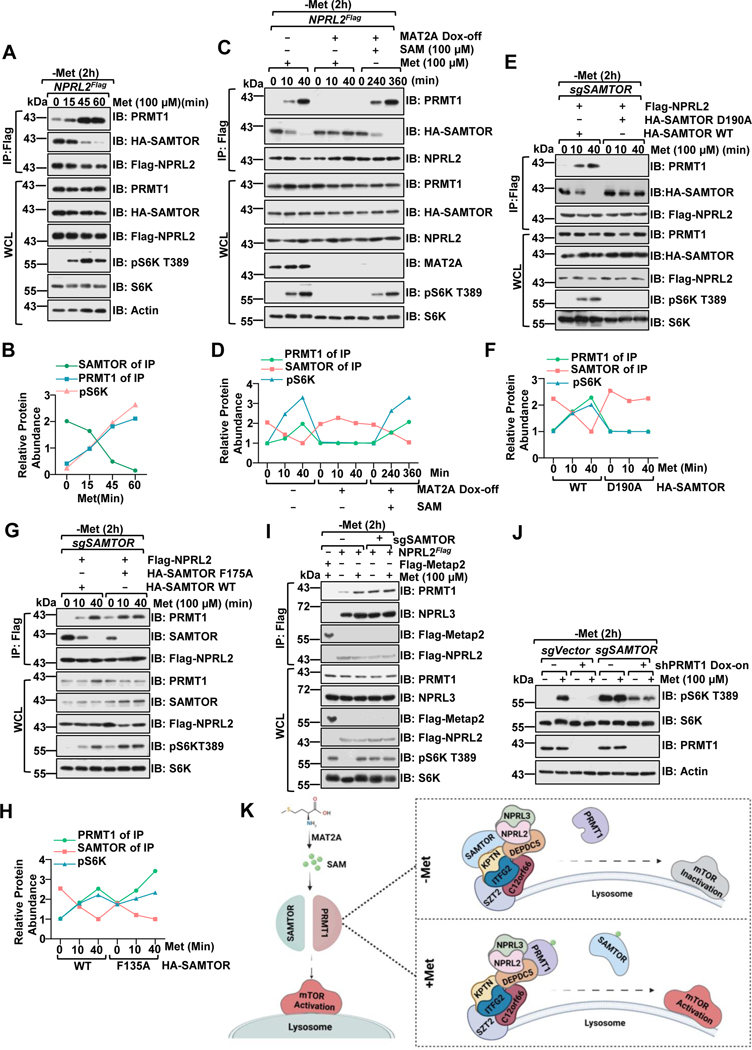
Figure 2. PRMT1 coordinates with SAMTOR to dictate mTORC1 activation.
A-B, NPRL2Flag knock-in HEK293T cells were starved of methionine for 2 hours and restimulated with methionine (100 μM) for the indicated time. Whole-cell lysis (WCL) and anti-FLAG immunoprecipitates (IPs) were analyzed via immunoblotting with the indicated antibodies. Quantified values of the immunoblotting of A were shown as in B. Data are representative one repeat.
C-D, NPRL2Flag knock-in HEK293T MAT2A Dox-off cell lines were generated as described in the previous study25. The stable cell lines were pre-treated with or without doxycycline (DOX) for an additional 2 days, starved of methionine for 2 hours, and restimulated with either methionine (100 μM) or SAM (100 μM) for the indicated time. WCL and anti-FLAG IPs were analyzed via immunoblotting with the indicated antibodies. Quantified values of the immunoblotting of C were shown in D. Data are representative one repeat.
E-H, HEK293 SAMTOR-null cells were transfected with Flag-NPRL2 and wild-type SAMTOR or the indicated D190A (E) or F135A (G) mutants, starved of methionine for 2 hours and restimulated with methionine (100 μM) for the indicated times. The WCL and anti-FLAG IPs were analyzed via immunoblotting with the indicated antibodies. Quantified values of the immunoblotting of E and G were shown as in F, H. Data are representative one repeat.
I, NPRL2Flag knock-in HEK293T cells expressing with or without sgSAMTOR were starved of methionine for 2 hours and restimulated with methionine (100 μM) for 20 min. The WCL and anti-FLAG IPs were analyzed via immunoblotting with the indicated antibodies.
J, SAMTOR and PRMT1 function in parallel to sense methionine availability to mTORC1. HEK293 cells were infected with sgControl, sgSAMTOR, or tet-on-shPRMT1 as indicated and selected with puromycin (1 μg/mL) for 4 days. Cells were pre-treated with or without DOX for 2 days to suppress PRMT1 expression and then challenged as in I, followed by lysis and immunoblotting with the indicated antibodies.
K, A schematic illustration of PRMT1-GATOR1-SAMTOR interaction and mTORC1 regulation in response to methionine signals.
See also Figure S2.

