Fig. 3.
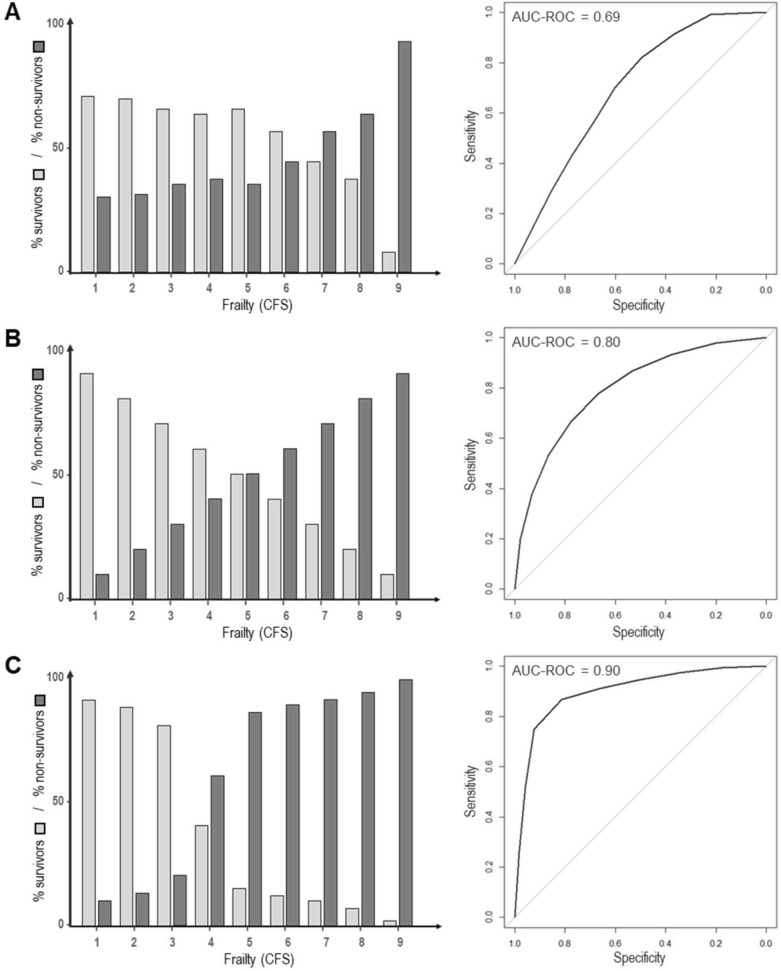
Illustration of discrimination of prediction models for simulated distributions of survival for various degrees of frailty, which was measured with the Clinical Frailty Scale (CFS) [39]. Percentages of ICU survivors and non-survivors per CFS category are depicted by light and dark bars, respectively, on the left side. The corresponding receiver operating characteristic (ROC) curves for survival predictions and the area under these curves (AUC-ROC) were obtained using the R package pROC [40] and are shown on the right side. Panel A depicts distributions of ICU survivors and non-survivors using information from the VIP2 study about the percentages in each CFS category [41]. Overall discrimination between the two outcomes (AUC-ROC = 0.69) is sub-optimal. Panel B shows a hypothetical scenario with a linear relationship between frailty (CFS) and ICU mortality. Despite the good AUC-ROC of 0.8, there is maximum uncertainty, i.e. a 50% chance of survival, for patients with CFS 5 (mild frailty). Panel C presents another hypothetical scenario resulting in an AUC-ROC of 0.9 which indicates a very good discrimination for the prediction model. However, the overlap at CFS 4 (very mild frailty) leads to substantial prognostic uncertainty for the patients in this particular frailty category

