Figure 3.
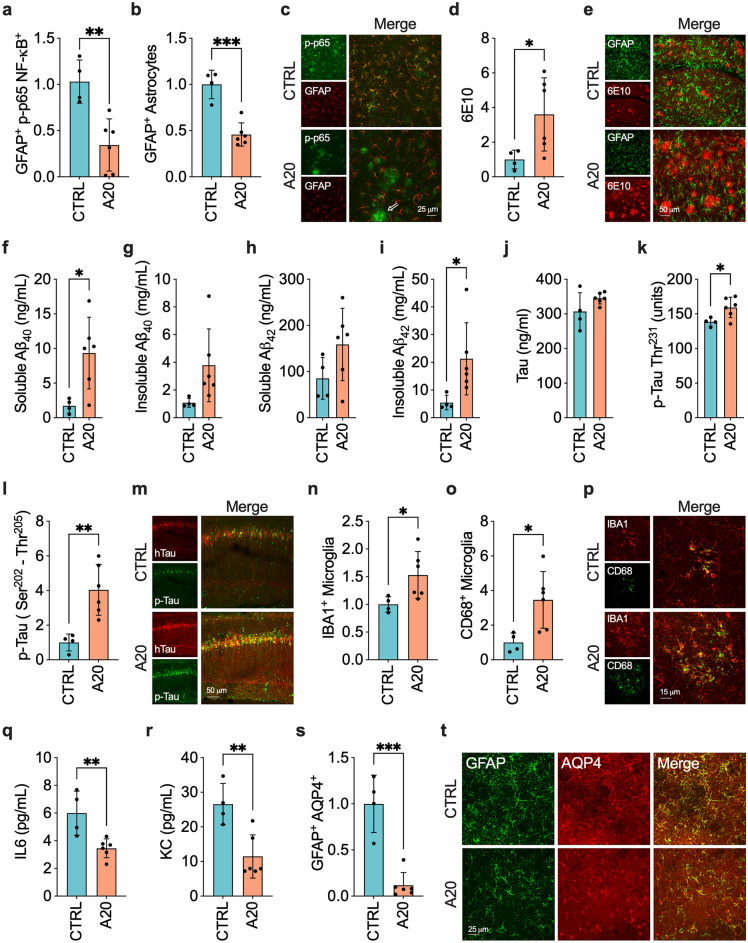
Changes in the hippocampus of 3xTgAD mice caused by overexpression of NF-κB inhibitor A20 in astrocytes. (a–c) Levels of (a) GFAP+-p-p65 NF-κB+ (n = 4–6 per group, three 3D images per mouse) and (b) GFAP+-astrocytes (n = 4–6 per group, nine 3D images per mouse) and (c) illustrative images. The arrow in the representative image indicates the presence of p-p65 NF-κB staining in clustered microglia-like cells. (d, e) 6E10+-Aβ plaques (n = 4–6 per group, nine 3D images per mouse) were higher in A20 expressing mice. (f–i) T-PER soluble and insoluble levels of Aβ peptides in hippocampal lysates (n = 4–6 per group). (j, k) Levels of (j) total and (k) phosphorylated-tau in T-PER soluble hippocampal lysates (n = 4–6 per group). (l) Levels of phosphorylated-tau and (m) representative images (n = 4–6 per group, three 3D images per mouse). (n–p) Levels of (n) IBA1+-microglia (n = 4–6 per group, nine 3D images per mouse) and (o) CD68+-microglia (n = 4–6 per group, six 3D images per mouse) and (p) representative images. (q, r) Levels of (q) IL6 and (r) KC in hippocampal lysates (n = 4–6 per group). Inhibition of astrocytic NF-κB did not alter IL1β, IL4, IL5, and TNFα levels. IFNγ, IL2, and IL12p70 levels were below the sensitivity of the multiplex kit. (s) Quantification of AQP4+-GFAP+ colocalization (n = 4–6 per group, three 3D images per mouse) and (t) representative images. Data were analyzed through an unpaired t-test. *P < 0.05; **P < 0.01; ***P < 0.001.

