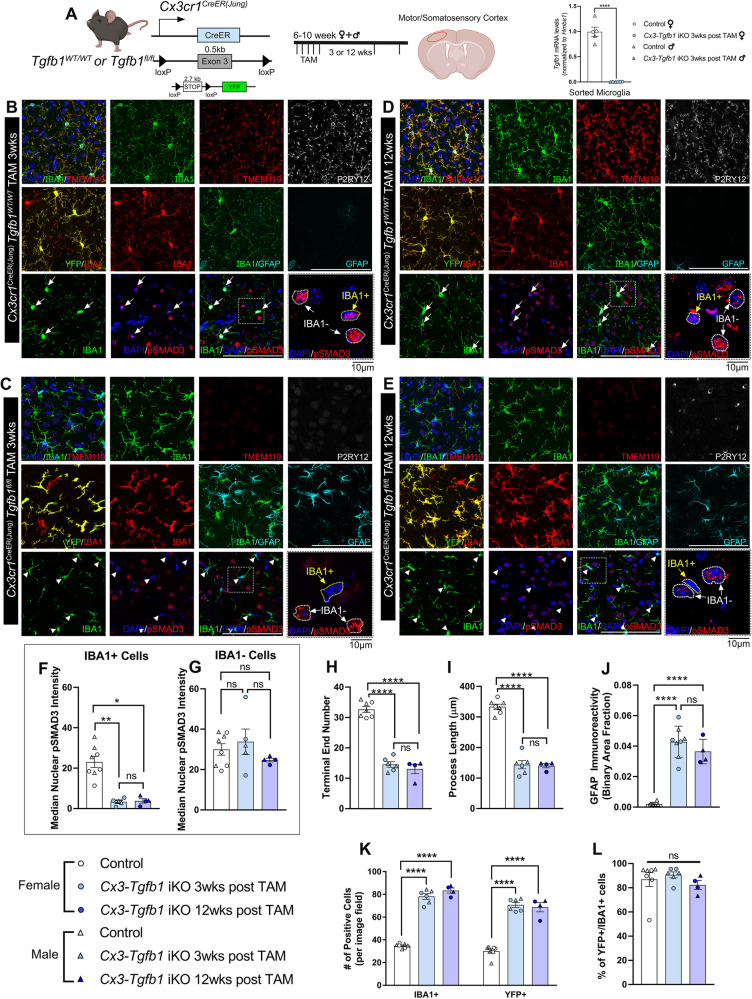
Fig. 1. Microglia-specific Tgfb1 gene deletion in a Cx3cr1CreER(Jung) driver line results in a loss of homeostasis of microglia and an increase in reactive astrocytes in the cortex of the adult mouse brain.
A (left) Mouse model for targeting microglial Tgfb1 and experimental timeline and (right) indicates the gene deletion efficiency in FACS-isolated microglia. B–E Representative images for immunohistochemistry stained for IBA1, TMEM119, P2RY12, YFP, GFAP, and pSMAD3 in B control Cx3cr1CreER(Jung)Tgfb1wt/wt + TAM animals, C Cx3cr1CreER(Jung)Tgfb1fl/fl mice + TAM at 3 weeks after TAM administration, D control Cx3cr1CreER(Jung)Tgfb1wt/wt + TAM animals, and E Cx3cr1CreER(Jung)Tgfb1fl/fl mice + TAM at 12 weeks after TAM administration. F, G Quantification for pSMAD3 fluorescent intensity from F IBA1+ and G IBA1− cells. H, I Microglial morphological quantification of the H terminal end number, and I the summation of process lengths. J GFAP immunoreactivity quantified by binary area fraction. K total IBA1+ or YFP+ cells and L percentage of YFP+ cells among total IBA1+ cells showing no change in % of YFP+ cell even 12 weeks after induction of Tgfb1 KO. A Right (n = 5 for control and n = 6 for KO, p = 0.0004, Welch’s t-test, two-sided); F, G (n = 8 for control, n = 5 for KO 3 week and n = 4 for KO 12 week, **p = 0.006 and *p = 0.029, Kruskal–Wallis test, Dunn’s multiple comparisons test); H, I, K, L (n = 7 for control, n = 6 for KO 3 week and n = 4 for KO 12 week) and J (n = 6 for control, n = 8 for KO 3 week and n = 4 for KO 12 week). Each data point represents the average of a single animal, and the sex of each animal is indicated in the figure legend. Mean ± SE, Scale bar = 100 µm unless otherwise noted. H–L One-way ANOVA, Tukey’s multiple comparisons test. *p < 0.05, **p < 0.01, ****p < 0.0001. A Left, was created with BioRender.com released under a Creative Commons Attribution-NonCommercial-NoDerivs 4.0 International license. Source data are provided as a source data file.

