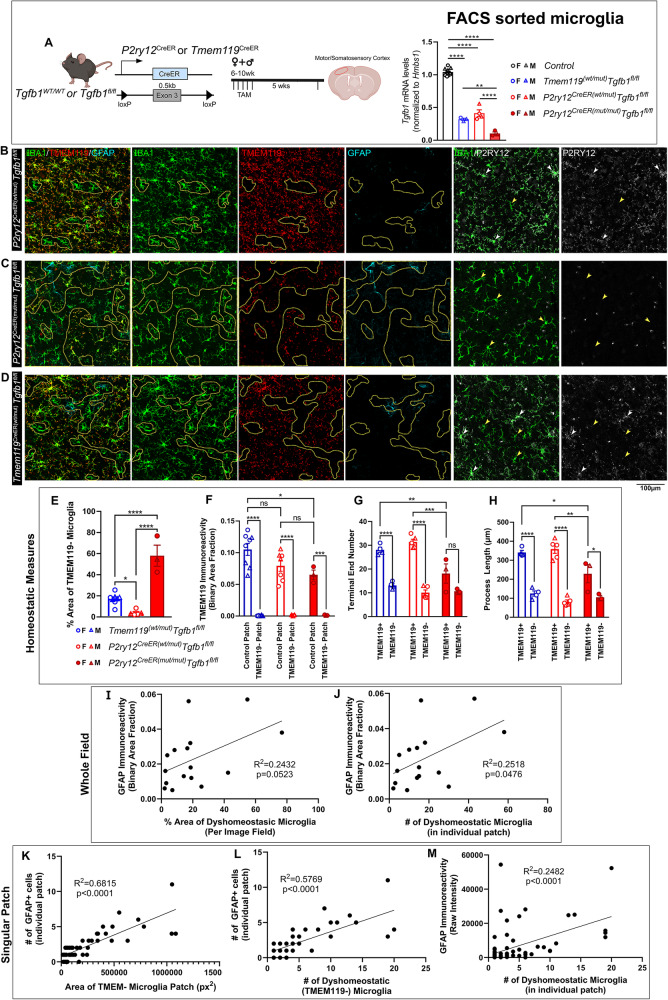
Fig. 4. Mosaic deletion of the Tgfb1 gene in subsets of parenchymal microglia in the P2ry12creERTgfb1fl/fl or the Tmem119CreERTgfb1fl/fl iKO mice leads to distinct patches of dyshomeostatic microglia in the adult mouse brain.
A (left) P2ry12CreER or Tmem119CreER mouse driver to induce Tgfb1 KO in P2RY12+ or TMEM119+ microglia and experimental timeline. A (right) Indicates the gene deletion efficiency in FACS-isolated microglia in all the different mouse lines (n = 10, 3, 4, 3 for each group presented, ****<0.0001 and **p = 0.0038). TAM treated, B P2ry12CreER(wt/mut)Tgfb1fl/fl, C P2ry12CreER(mut/mut)Tgfb1fl/fl, and D Tmem119CreER(wt/mut)Tgfb1fl/fl iKO representative images showing immunohistochemistry for IBA1, TMEM119, P2RY12, and GFAP. Yellow dotted outlines indicate microglia regions with downregulated TMEM119 expression. White arrows depict homeostatic IBA1+ cells that still express P2RY12 expression. Yellow arrowheads show IBA1+ cells that are no longer expressing P2RY12. E Quantification of % area of TMEM− regions across all three lines in the whole image field (n = 8, 5, 3 for each group presented, ****<0.0001 and *p = 0.0312, panel A, right and E are analyzed by one way ANOVA, two-sided, Tukey’s multiple comparisons). F Quantification of TMEM119 expression in P2ry12CreER(wt/mut)Tgfb1fl/fl, P2ry12CreER(mut/mut)Tgfb1fl/fl, and Tmem119CreERTgfb1fl/fl (n = 8, 7, 3 for each group presented, *p = 0.0162, ***p = 0.0008, and ****<0.0001). G, H Quantification of microglia morphology across the three different mouse lines for G terminal number and H process length (n = 4, 5, 3 for each group, *p = 0.0306 and 0.0237, **p = 0.0078 and 0.0016, ***p = 0.0002 and ****p < 0.0001. F–H Analyzed by two-way ANOVA, two-sided, Tukey’s multiple comparison). I, J Correlation of total GFAP immunoreactivity vs % area or a number of dyshomeostatic microglia based on TMEM− the area from representative images across all 3 mouse lines. K–M Correlations of different parameters within an individual dyshomeostatic patch comparing K number of GFAP+ cells vs % area of TMEM− microglia, L number of GFAP+ cells vs number of TMEM− dyshomeostatic microglia, and M GFAP immunoreactivity vs a number of dyshomeostatic TMEM− microglia. Mean ± SE, for correlations, a simple linear regression was used for analysis. Scale bar = 100 µm. A Left, was created with BioRender.com released under a Creative Commons Attribution-NonCommercial-NoDerivs 4.0 International license. Source data are provided as a source data file.

