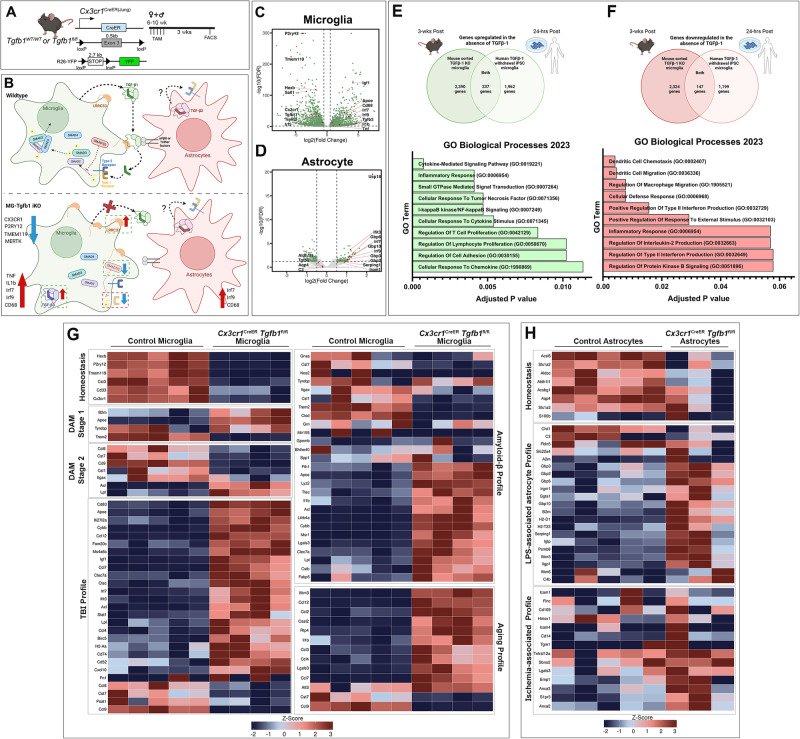
Fig. 7. Transcriptomic analysis of microglia and astrocyte cells sorted from Cx3cr1CreER(Jung)Tgfb1 iKO mice.
A Mouse model was used to induce Tgfb1 KO and YFP reporter in microglia. B Schematic model showing the summary of transcriptomic changes in microglia or astrocytes pertaining to both inflammatory responses and critical TGF-β signaling component genes, for individual gene list see supplemental information. C, D Volcano plot showing expression log fold changes in microglia or astrocytes comparing iKO vs Control mice. E, F Upregulated and downregulated genes common to this bulk RNA-seq data set and the sequencing results from Abud et al. (human microglia-like cells derived from iPSCs subjected to TGF-β withdrawal for 24 h) and gene ontology (GO) term analysis of overlapping genes from the two data sets. GO analysis was performed using the Enrichr online database. p Values were calculated using Fisher’s exact test, and adjustments for multiple comparisons were made using the Benjamini–Hochberg method. G Microglial differential gene expression observed across various gene sets including, homeostatic microglia genes50–53, stage 1 and 2 disease-associated microglia (DAM) genes51, injury exposed microglial (TBI)53, amyloid beta exposed microglia50,52,53, and aged microglia52,53. H Astrocytic differential gene expression was observed across different gene sets including, homeostatic astrocyte genes, LPS-associated, and ischemia-associated astrocytic genes. Z-scores were calculated and plotted to display differential gene expression54. The astrocyte sample that had an RIN < 8 was excluded from this analysis. A, B, E, and F Created with BioRender.com and released under a Creative Commons Attribution-NonCommercial-NoDerivs 4.0 International license. Source data are provided as a source data file.

