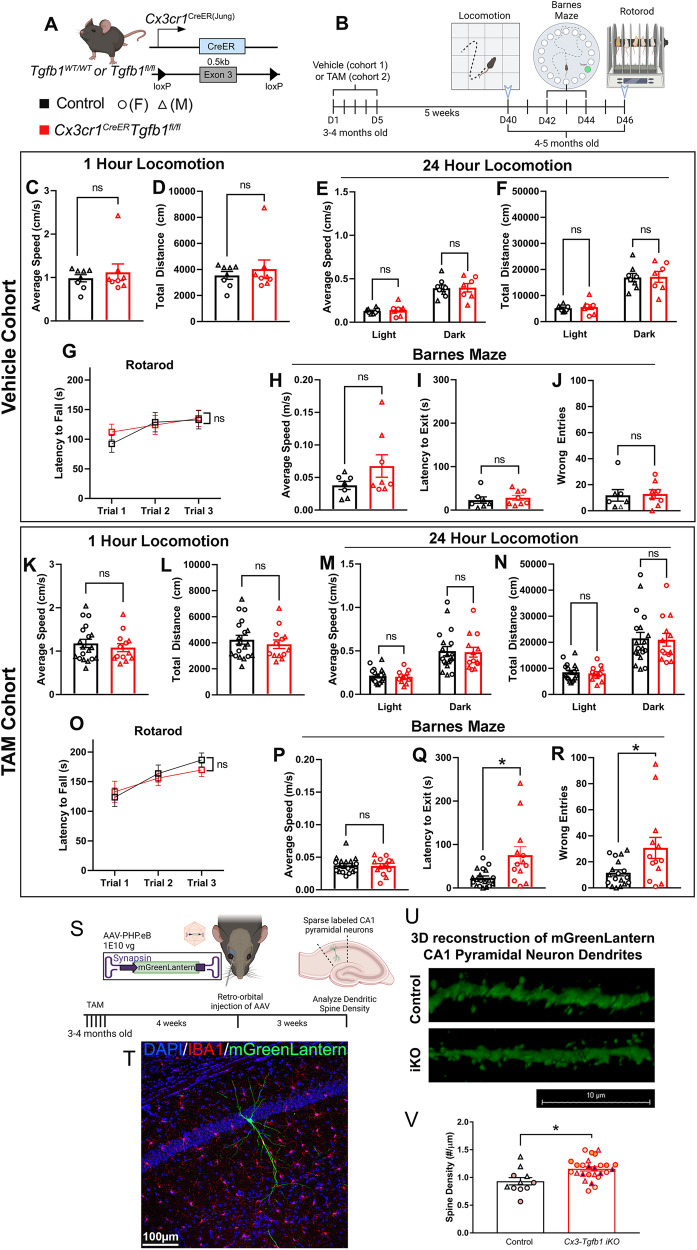
Fig. 8. Behavioral assessment shows normal general motor function and motor learning but defective spatial learning and memory in young adult Cx3cr1CreERTgfb1fl/fl iKO mice and increased dendritic spine density in hippocampal CA1 neurons.
A Mouse model was used to induce Tgfb1 KO in microglia. B Experimental timeline, showing the order of behavioral measurements. C–J Behavioral measurements in vehicle-treated Cx3cr1CreERTgfb1wt/wt or Cx3cr1CreERTgfb1fl/fl mice showing open field test (OFT) of the first hour in locomotion chamber C average speed and D total distance traveled. E, F Average speed and total distance during the light and dark cycles in a 23-h period. G Accelerated rotarod learning test. H–J Barnes maze test showing H average speed during testing, I latency to locating the target hole, and J number of error trails before locating the target hole (n = 8 for each group, Student’s t-test, two-sided). K–R Behavioral measurements from TAM-treated control and iKO mice showing open field test (OFT) of the first hour in locomotion chamber K average speed and L total distance traveled. M, N Average speed and total distance during the light and dark cycles in a 23-h period. O Accelerated rotarod learning test. P–R Barnes maze test showing P average speed during testing, Q latency to locating the target hole, and R number of error trails before locating the target hole. (control n = 19, iKO n = 13) (ns = not significant, *p = 0.0210 for panel Q, and *p = 0.0398 for panel R, Unpaired t-test with Welch’s correction, two-sided). S Experimental design and timeline for systemic AAV for neuronal labeling in MG-Tgfb1 iKO mice. T Representative image of a sparse CA1 hippocampal neuron labeled with the AAV-PHP.eB syanpsin-mGreenLantern virus. U 3D reconstruction of mGreenLantern CA1 pyramidal basal neuron dendrites from control and iKO mice. V Quantification of spine density (n = 11 control and n = 26 individual dendritic segments pooled from n = 3 control mice and n = 4 iKO mice (dendritic segments from the same animal is color coated, circle indicates female, and triangle indicates male. Statistical analysis was carried out using the average from individual mice as a single n, *p = 0.0316, Student’s t-test, two-sided). Mean ± SE. Scale bars: 10 µm or 100 µm as indicated. A, B, and S Created with BioRender.com and released under a Creative Commons Attribution-NonCommercial-NoDerivs 4.0 International license. Source data are provided as a source data file.

