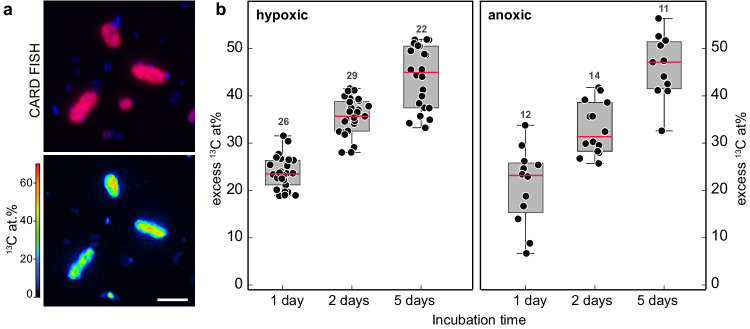
Fig. 4. Activity of large rod-shaped gamma-MOB under anoxic conditions determined by nanoSIMS analyses.
a CARD FISH image (using probes Mγ84 and Mγ705) and corresponding nanoSIMS measurements of large rod-shaped gamma-MOB (red) showing substantial 13C enrichment under anoxic conditions. Images and measurements as shown in (a) were obtained from samples collected after 8 days of anoxic incubation. b Excess 13C at.% of large rod-shaped gamma-MOB after incubation with 13C-labeled methane for 1, 2, and 5 days under hypoxic (left) and anoxic (right) conditions. 13C at.% values are given as excess values for each analyzed cell. The 0 value on the y-axis depicts the natural abundance of 13C (1.1%). The number of cells analyzed per category (n) is shown as scatter and indicated above each boxplot. Boxplots depict the 25–75% quantile range, with the center line representing the median (50% quantile, highlighted in red) and whiskers representing the 5 and 95 percentile. Source data are provided as a Source Data file.

