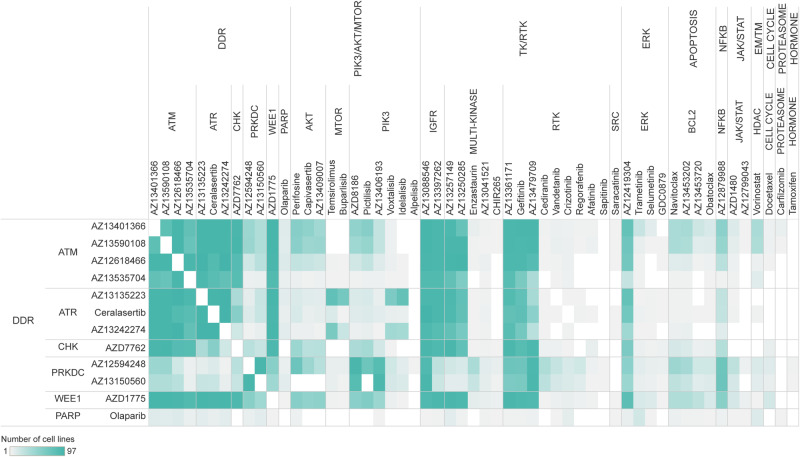
Fig. 5. In vitro combination synergy measurements used for benchmarking analysis of in silico synergy predictions.
The heatmap represents the number of cell lines in our in silico screen searching for potentially synergistic drug combinations, which overlap between the DREAM challenge and our dataset for each exact combination. The drugs were categorized into MoA groups based on the molecular targets of the compounds with the lowest binding affinity value. We had the best coverage of in vitro experimental data points in the case of DDRi:DDRi and DDRi:TK/RTKi combinations, also we managed to gather a good amount of data points regarding some DDRi:PIK3/AKT/MTORi combination-cell line pairs. For the rest of the combinations, coverage of in vitro measurements was poor.

