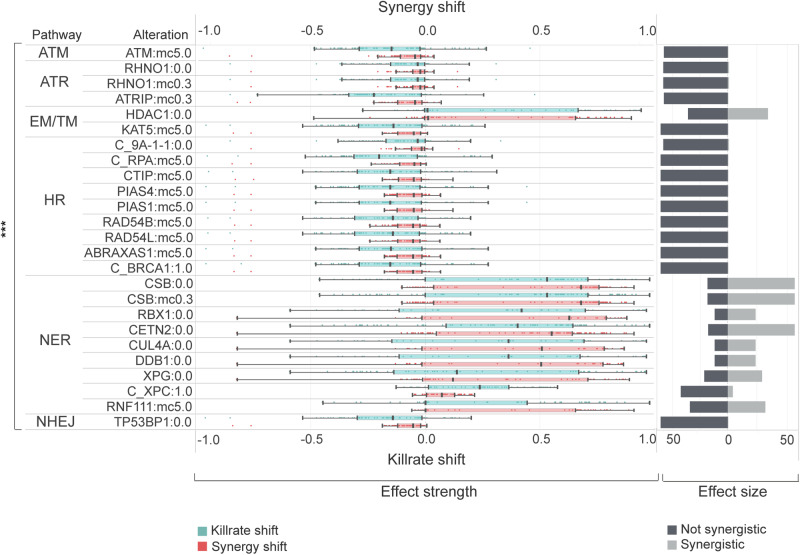
Fig. 7. Effect strength and effect size of combination-specific biomarkers for ATMi:PARPi combination.
This figure represents the statistically significant (p < 0.001, Wilcoxon rank sum test) shift of killrate and synergy influencing biomarkers in cell lines. Biomarker perturbation is an alteration that caps the maximum and or minimum value of the protein representing a node’s activity and concentration parameter. Combination-specific biomarkers can shift the synergy of a drug combination but failed to generate IC50 shift in terms of the monotherapy response of the corresponding drugs. Alterations for biomarker screening are described in detail in Supplementary Methods 2. Horizontal bars demonstrate the sample size for each biomarker, while the distribution of effect strength components (killrate shift and synergy shift) are represented in boxplots. The loss of NER genes has a favorable influence both on synergy and killrate, while the gaining of HR, ATM, ATR, and NHEJ members have a negative power on effect strength components. Legend: ***statistically significant p ≤ 0.001, 0.0 loss-of-function, 1.0 gain-of-function, mc5.0 overexpression, mc0.3 underexpression, C_ protein complex. ATM ataxia-telangiectasia mutated kinase pathway, ATR ATM and rad3-related pathway, EM/TM Epigenetic and transcriptomic regulation, HR homologous recombination, NER nucleotide excision repair, NHEJ non-homologous end joining.

