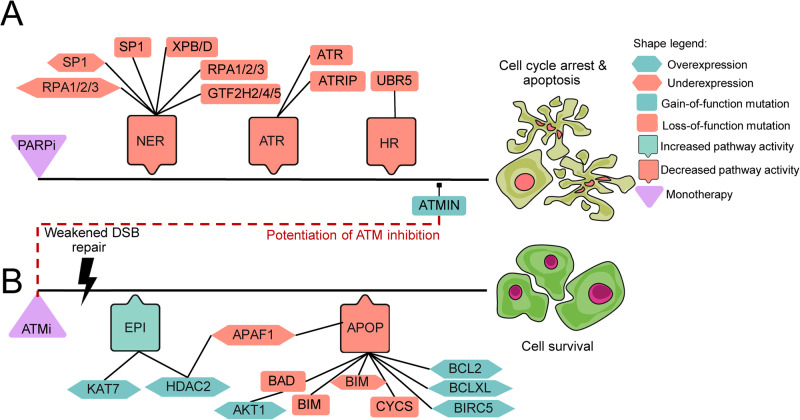
Fig. 9. Signaling topology of detected alterations for ATMi and Olaparib can be followed based on the signal propagation in the Simulated Cell network.
This visualization represents how each of our predicted monotherapy biomarkers could influence drug responses. Black line represents a theoretical upstream-downstream topology of detected biomarkers based on our signaling network. A PARP inhibitor-specific sensitizing biomarkers responsible for the downregulation of NER, ATR, and HR pathways which results in triggering cell cycle arrest and apoptosis. B ATM inhibitor-specific resistance biomarkers are upregulating some members of epigenetic regulation (EPI) which results in the effect of suppressed apoptosis (APOP). Further apoptosis downregulating biomarkers were also observed. Red dashed line represents the point in signaling where the benefit of combining the two chosen drugs could emerge. Since ATMIN gain-of-function surfaced as a sensitizing biomarker of PARP inhibition, this could explain how the combination can overcome the resistance that emerged upon ATM inhibition. The connection between the biomarkers is indirect and shows signal propagation from the drug target to the outcome only.

