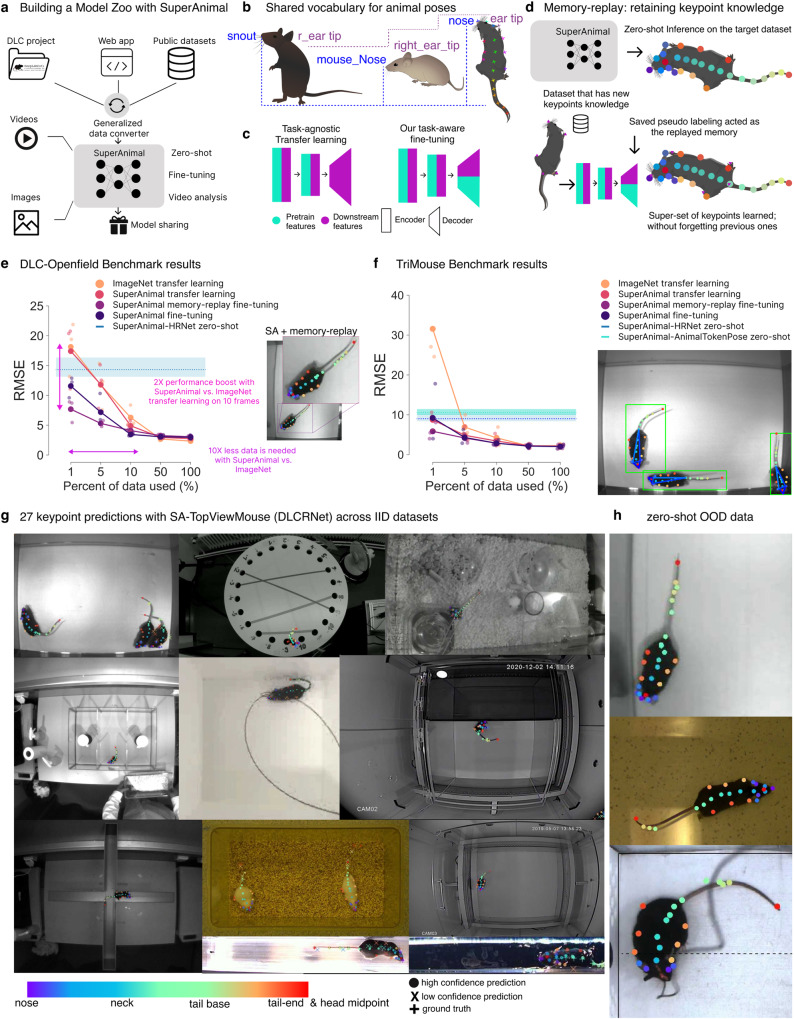
Fig. 1. The DeepLabCut Model Zoo, the SuperAnimal method, and the SuperAnimal-TopViewMouse model performance.
a The website can collect data shared by the research community; SuperAnimal models are trained and can be used for inference on novel images and videos with or without further training (fine-tuning). b The panoptic animal pose estimation approach unifies the vocabulary of pose data across labs, such that each individual dataset is a subset of a super-set keypoint space, independently of its naming. Mouse cartoons from scidraw.io: https://beta.scidraw.io/drawing/87, https://beta.scidraw.io/drawing/49, https://beta.scidraw.io/drawing/183. c For canonical task-agnostic transfer learning, the encoder learns universal visual features from ImageNet, and a randomly initialized decoder is used to learn the pose from the downstream dataset. For task-aware fine-tuning, both encoder and decoder learn task-related visual-pose features in the pre-training datasets, and the decoder is fine-tuned to update pose priors in downstream datasets. Crucially, the network has pose-estimation-specific weights. d Memory replay combines the strengths of SuperAnimal models’ zero-shot inference, data combination strategy, and leveraging labeled data for fine-tuning (if needed). Mouse cartoon from scidraw.io: https://beta.scidraw.io/drawing/183. e Data efficiency of baseline (ImageNet) and various SuperAnimal fine-tuning methods using bottom-up DLCRNet on the DLC-Openfield OOD dataset. 1–100% of the train data is 10, 50, 101, 506, and 1012 frames respectively. Blue shadow represents minimum, maximum and blue dash is the mean for zero-shot performance across three shuffles. Large, connected dots represent mean results across three shuffles and smaller dots represent results for individual shuffles. Inset: Using memory replay avoids catastrophic forgetting. f SuperAnimal vs. baseline results on the TriMouse benchmark, showing zero-shot performance with top-down HRNet and AnimalTokenPose, and fine-tuning results with HRNet. 1–100% of the train data is 1, 7, 15, 76, and 152 frames respectively Inset: example image of results. g SuperAnimal-TopViewMouse (DLCRNet) qualitative results on the within-distribution test images (IID). They were randomly selected based on the visibility of the keypoints within the figure (but not on performance). Full keypoint color and mapping are available in Supplementary Fig. S1). h Visualization of model performance on OOD images using DLCRNet. (e, f, g) Images in (e–h) are adapted from https://edspace.american.edu/openbehavior/video-repository/video-repository-2/ and released under a CC-BY-NC license: https://creativecommons.org/licenses/by-nc/4.0/.

