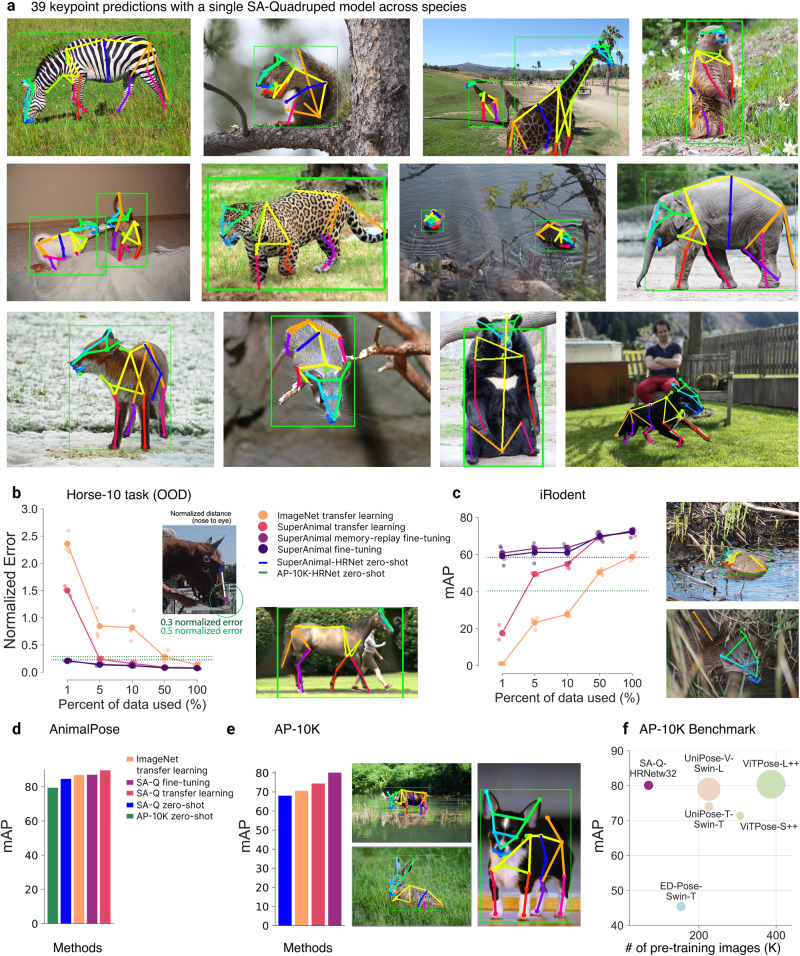
Fig. 2. SuperAnimal-Quadruped.
a Qualitative performance with SuperAnimal-Quadruped (HRNet-w32). Image randomly selected based on visibility of the keypoints within the figure (but not on performance). A likelihood cutoff of 0.6 was applied for keypoint visualization. Full keypoint color and mapping are available in Supplementary Fig. S1). Images in panels a and e are adapted from https://github.com/AlexTheBad/AP-10K/blob/main/LICENSE and are under a CC-BY license: https://creativecommons.org/licenses/by/4.0/ Bottom right image is courtesy of the authors. HRNet-w32 and same cutoff of 0.6 are used in other panels. b Performance on the official OOD Horse-10 test set, training with the official IID splits, reported as a normalized error from eye to nose, see inset adopted from ref. 16 and qualitative zero-shot performance. HRNet-w32 is trained on AP-10K and Quadruped-80K, respectively, for zero-shot performance comparison. 1–100% of the data is 14, 73, 146, 734, and 1469 frames, respectively. The (b) images are adapted from https://www.mackenziemathislab.org/horse10 and released under a CC-BY-NC license: https://creativecommons.org/licenses/by-nc/4.0/. c Performance on the OOD iRodent dataset, reported mAP. Colors and zero-shot baseline are as in (b). 1–100% of the data is 3, 17, 35, 177, and 354 frames, respectively. See inset for qualitative zero-shot performance. Images in (c) are adapted from iNaturalist https://www.inaturalist.org/ and are under a CC-BY license: https://creativecommons.org/licenses/by/4.0/. d Performance on the OOD AnimalPose dataset, reported as mAP. HRNet-w32 trained on AP-10K is used as an additional zero-shot baseline. Benchmark images cannot be shown due to copyright concerns, but please see ref. 51. e Performance on the OOD AP-10K dataset, reported as mAP. Qualitative zero-shot performance is also shown. AP-10K raw images are licensed under CC-BY: https://creativecommons.org/licenses/by/4.0/. f AP-10K benchmark with SA-Q and other pose data pre-trained models. The size of dots represents the parameter size of each model. The number of pre-training images represents the number of pose data models trained before being fine-tuned on AP-10K.

