FIGURE 1.

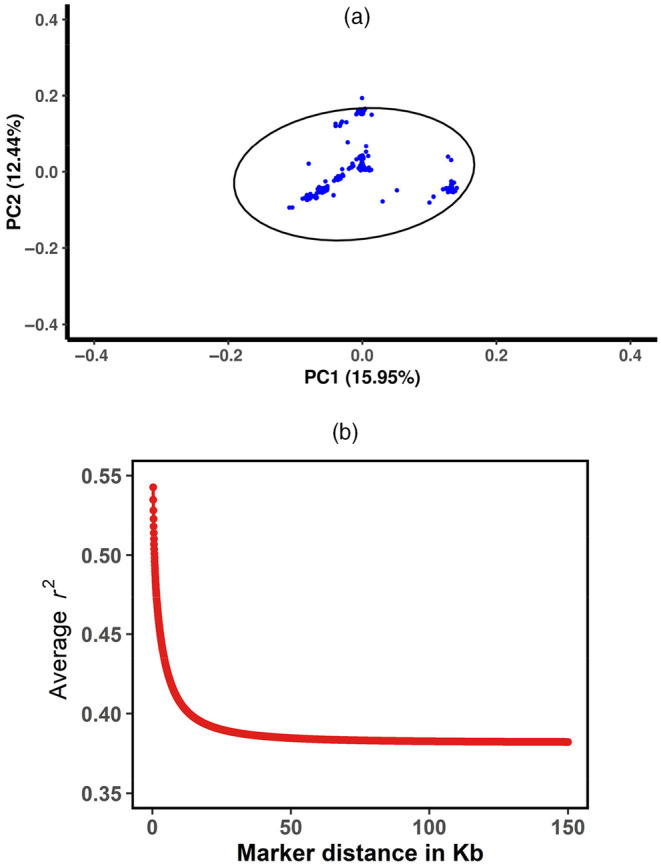
Population structure analysis. (a) Principal component analysis. (b) The decay of r 2 with pair‐wise SNP marker distances in Hu sheep.

Population structure analysis. (a) Principal component analysis. (b) The decay of r 2 with pair‐wise SNP marker distances in Hu sheep.