FIGURE 3.

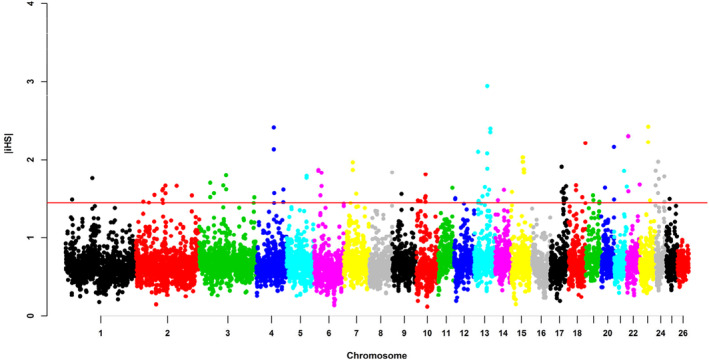
The distribution of selection signatures detected by iHS across the genome. The red line (1.45) was the threshold line of the candidate windows at the top 1% of the empirical distribution.

The distribution of selection signatures detected by iHS across the genome. The red line (1.45) was the threshold line of the candidate windows at the top 1% of the empirical distribution.