FIGURE 4.

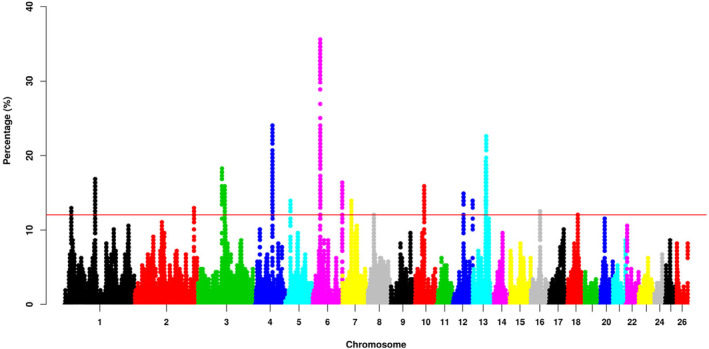
Manhattan plot of the occurrence (%) of SNPs in ROH across all individuals. The red line was the top 0.1% of SNPs observed in ROHs.

Manhattan plot of the occurrence (%) of SNPs in ROH across all individuals. The red line was the top 0.1% of SNPs observed in ROHs.