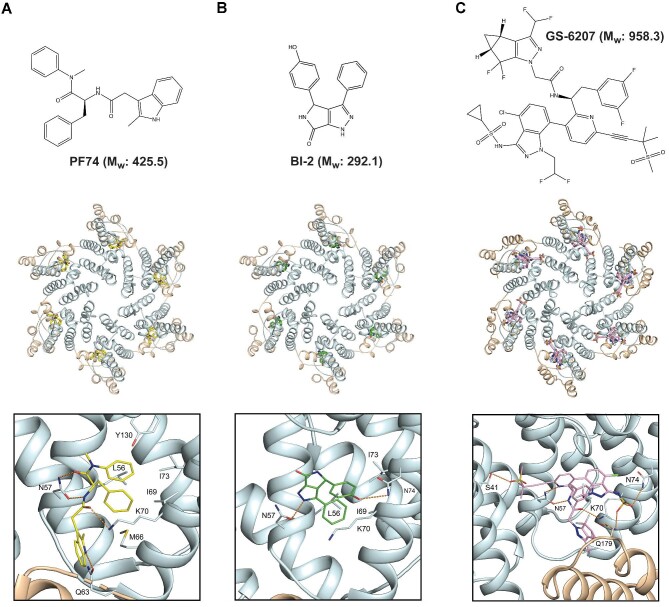
Figure 3.
The HIV-1 capsid–drug interactions. Upper panels: chemical structures and relative molecular weights (Mw) of drug molecules PF74 (A), BI-2 (B), and GS-6207 (C). Middle panels: the HIV-1 capsid hexamer can bind to PF74 (PDB: 4U0E; A), BI-2 (PDB: 4U0F; B), and GS-6207 (PDB: 6VKV; C). The capsid protein backbone is shown in cartoon representation, with CA-NTDs in light cyan and CA-CTDs in wheat. Drugs are shown in stick representation bound at the α3–α4–α7 pocket. Lower panels: details of molecular interactions at the drug binding sites. Drug molecules and capsid residues that make interactions are shown in stick representation. Hydrogen bonds are represented with orange dashed lines.

