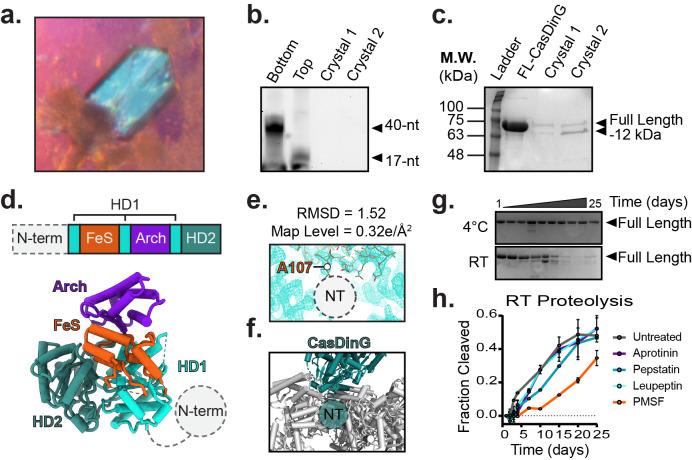
Figure 1. Characterization of CasDinG crystals.
a. ) Photograph of CasDinG crystal. b. ) Analysis of DNA content of crystals by urea-PAGE. c. ) Analysis of protein content of crystals by SDS-PAGE. d. ) Cartoon model Pa CasDinG atomic coordinates with primary sequence (above) and model colored by domain. e. ) Electron density of Pa CasDinG with the most N-terminal resolved residue (A107) indicated. No density is observed that corresponds to the N-terminal domain. f. ) CasDinG (teal) with symmetry mates (grey). No space is available for the N-terminal domain in the crystal packing. g. ) Pa CasDinG proteolysis time-course at 4℃ (top) and room temperature (bottom). h. ) Time course of Pa CasDinG room temperature proteolysis in the presence of different protease inhibitors.

