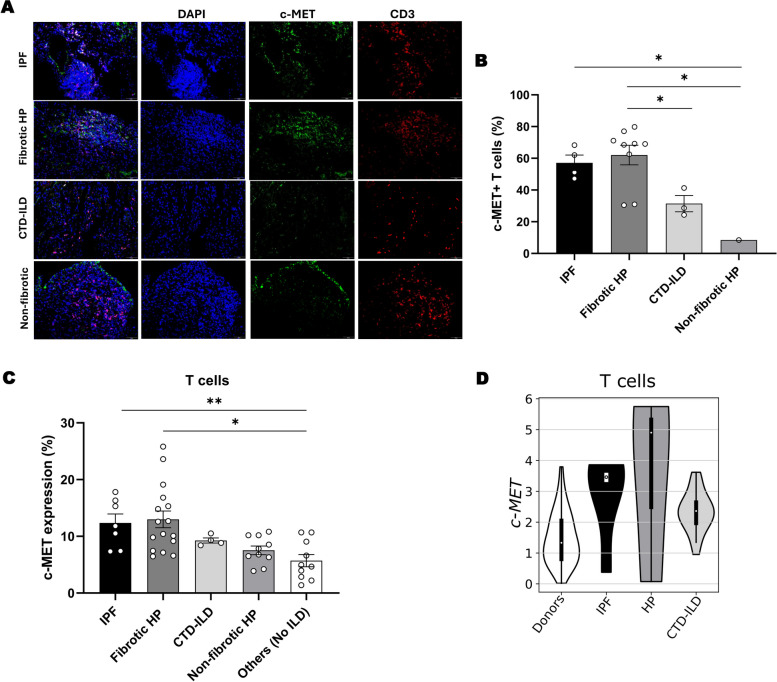
Fig. 6.
c-MET expression is augmented in T cells in fibrosis-related ILDs. (A) Representative images of immunofluorescence on c-MET (green) in T cells (red) and (B) respective expression quantification on human lung sections from a cohort of patients. Original magnification × 20, scale bar 50 µm. (C) Percentage of T cells with c-MET expression, quantified by flow cytometry on cryopreserved BAL samples from a cohort of patients. (D) Plot representing expression of c-MET in T cells from donor and ILD patients. n = 1–16 per group. Data are expressed as mean ± SEM and were analyzed with Kruskal–Wallis test with Dunn's multiple comparisons test. *p < 0.05, **p < 0.01

