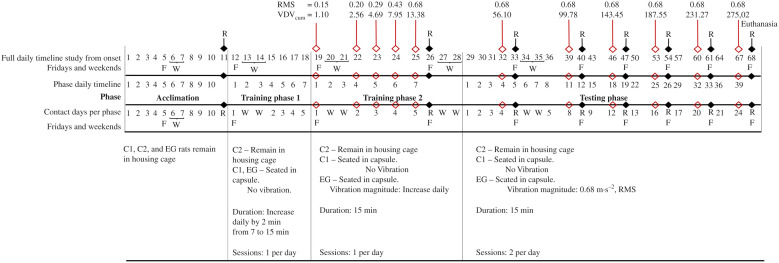
Figure 4.
Timeline indicating the 4 phases of the experiment. RMS, root mean square acceleration in m·s−2; VDVcum, cumulative vibration dose value in m·s−1.75; R, radiographic imaging day; F, Fridays; W, weekend (Saturday and Sunday); C1, control group 1; C2, control group 2; EG, experimental group.

