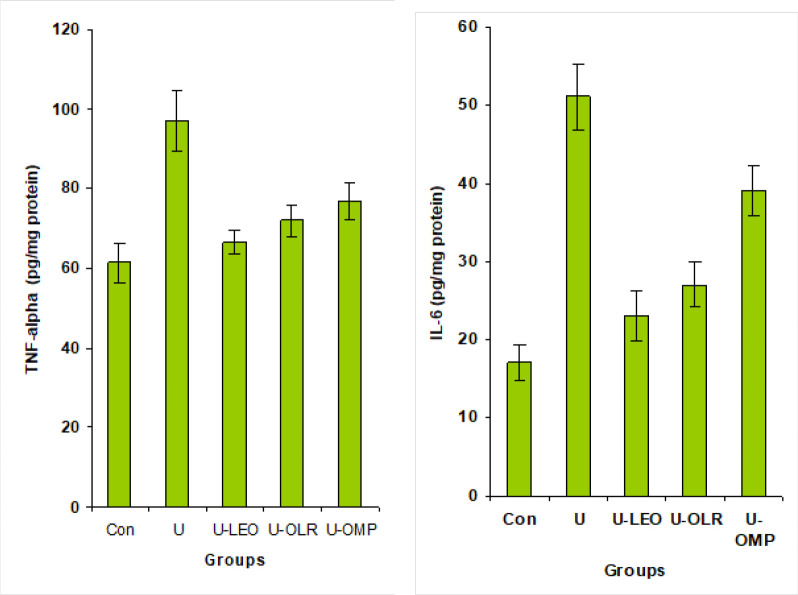
Figure 4.
Gastric TNF-α and IL-6 levels in OLE and OLR gastric ulceration treated rats
Each value represents the mean±SEM for each group (n=5). The statistical analysis is presented as follows: *P<0.05 vs normal rats; #P<0.05 vs ethanol-induced gastric ulcer in rats. @P<0.05 vs ethanol-induced gastric ulcer in rats treated with OLE; &P<0.05 vs ethanol-induced gastric ulcer in rats. @P<0.05 vs ethanol-induced gastric ulcer in rats treated with OLR
OLE: Oleaster leaf extract; OLR: Oleuropein

