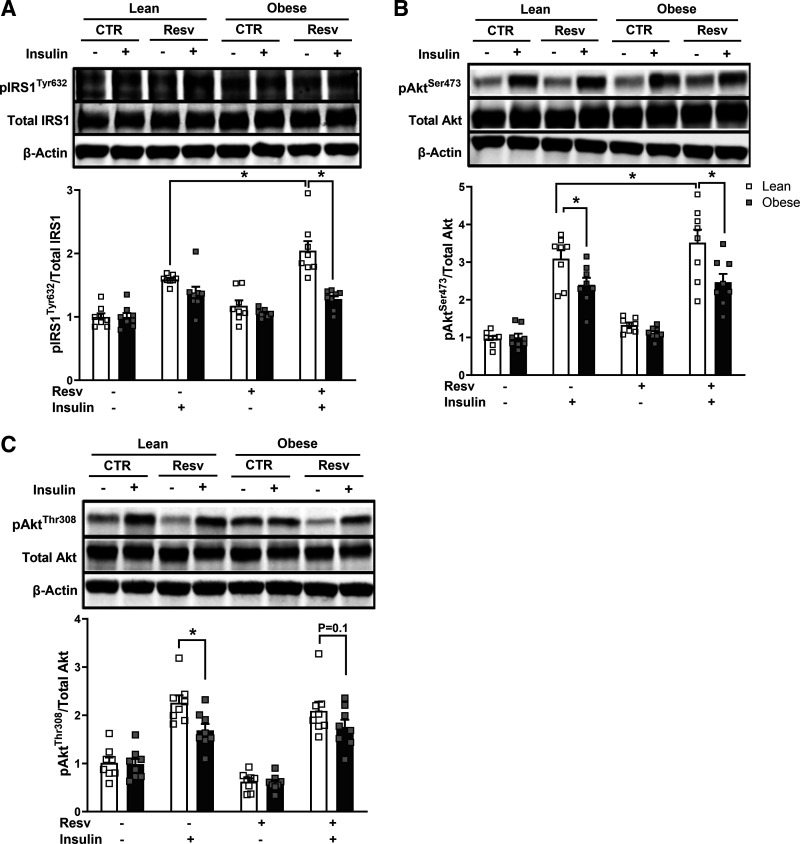
Figure 2.
Insulin signal transduction in the absence or presence of 100 nM insulin in myotubes from lean and subjects with severe obesity in response to 24 h of resveratrol treatment (Resv). A: IRS1 (Tyr632) phosphorylation. B: Akt (Ser473) phosphorylation. C: Akt (Thr308) phosphorylation. Following detecting significance for either group, treatment and/or interaction effect using three-way ANOVA, distinguishing meaningful differences were performed using a two-tailed Student’s t test. There were main effects (P < 0.05) for insulin and resveratrol for all the proteins and for subject group for pIRS1 and pAkt (Ser473). There were interaction effects (P < 0.05) for subject group with resveratrol for pIRS1 and pAkt (Ser473) and for subject group with insulin for pIRS1. Data are presented as means ± SE. n = 8 per group (all females); *P < 0.05 for selected comparison. CTR, control.

