Figure 3.
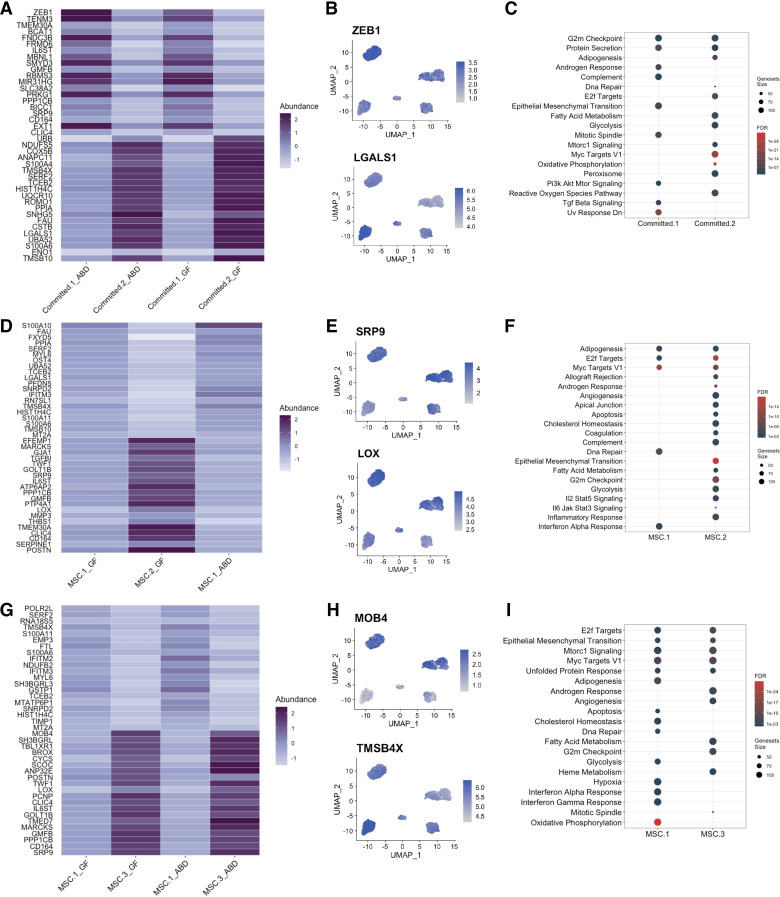
Unique transcriptome of depot specific adipose-derived stem cell (ADSC) subpopulations. Heatmap representation of the top 20 differentially expressed genes between Committed-1 and Committed-2 subpopulations in abdominal (ABD) and gluteofemoral (GF) depots (A). Feature plot showing expression of ZEB1 and LGALS1 genes (B). Dot-plot showing the significant pathways that are upregulated in each cluster, FDR < 0.05 (C). Heatmap representation of the top 20 differentially expressed genes between mesenchymal stem cell (MSC)-1 and MSC-2 subpopulations in ABD and GF depots (D). Feature plot showing expression of POSTN and SRP9 genes (E). Dot-plot showing the significant pathways that are upregulated in each cluster, FDR < 0.05 (F). Heatmap representation of the top 20 differentially expressed genes between MSC-1 and MSC-3 subpopulations (G). Feature plot showing expression of MOB4 and TMSB4X genes (H). Dot-plot showing the significant pathways that are upregulated in each cluster, FDR < 0.05 (I).

