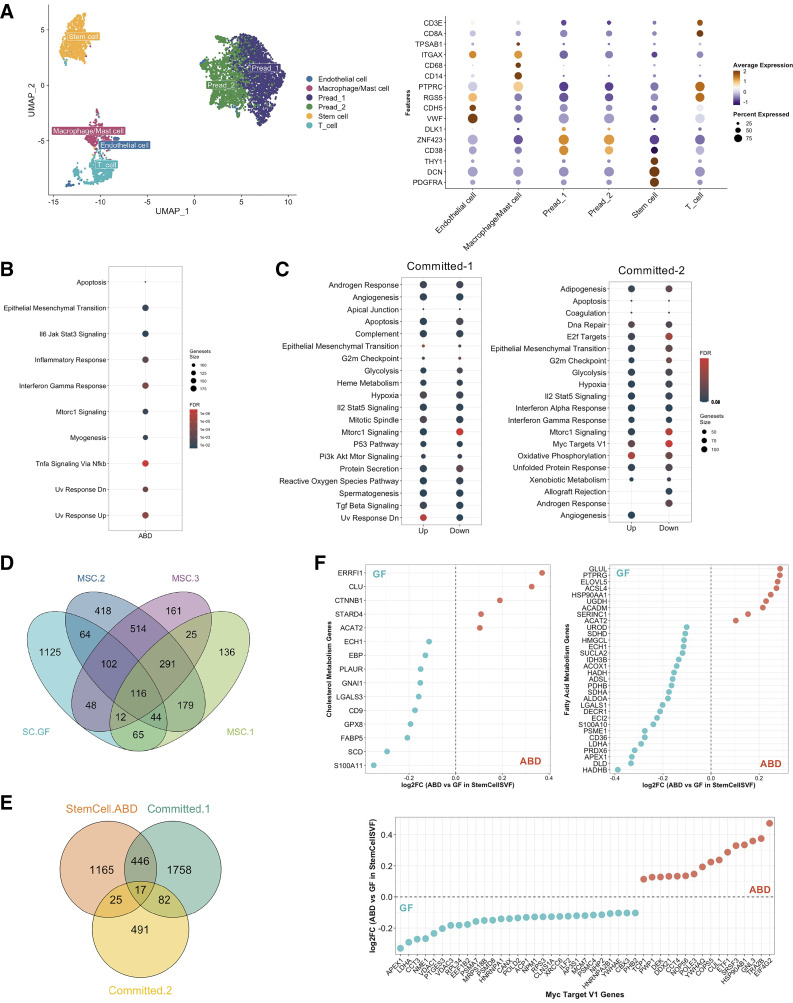
Figure 4.
Comparison with in vivo data. UMAP of 5,817 stroma vascular fraction (SVF)-cells from abdominal (ABD) and gluteofemoral (GF) subcutaneous white adipose tissue of five healthy women and dot-plot showing expression of selected marker genes used to label the six clusters (A). Dot-plot showing the significant pathways that are upregulated in ABD vs. GF depot for the stem cell cluster, FDR < 0.05, no pathways were identified in GF depot (B). Dot-plot showing the significant pathways that are up- and downregulated in Committed-1 and Committed-2 clusters vs. all the other adipose-derived stem cell (ADSC)-clusters, FDR < 0.05 (C). Venn diagram displaying the number of overlapping genes that were upregulated in the stem cell (SC) cluster in GF and in each mesenchymal stem cell (MSC)-ADSC clusters (D). Venn diagram displaying the number of overlapping genes that were upregulated in the stem cell cluster in ABD and in each committed-ADSC clusters (E). Comparison of differentially expressed genes in MSC-2 and MSC-3 in relation to differences between ABD and GF stem cell cluster (F). Blue dots mean genes are upregulated in GF stem cells and red dots mean genes are upregulated in ABD stem cells.

