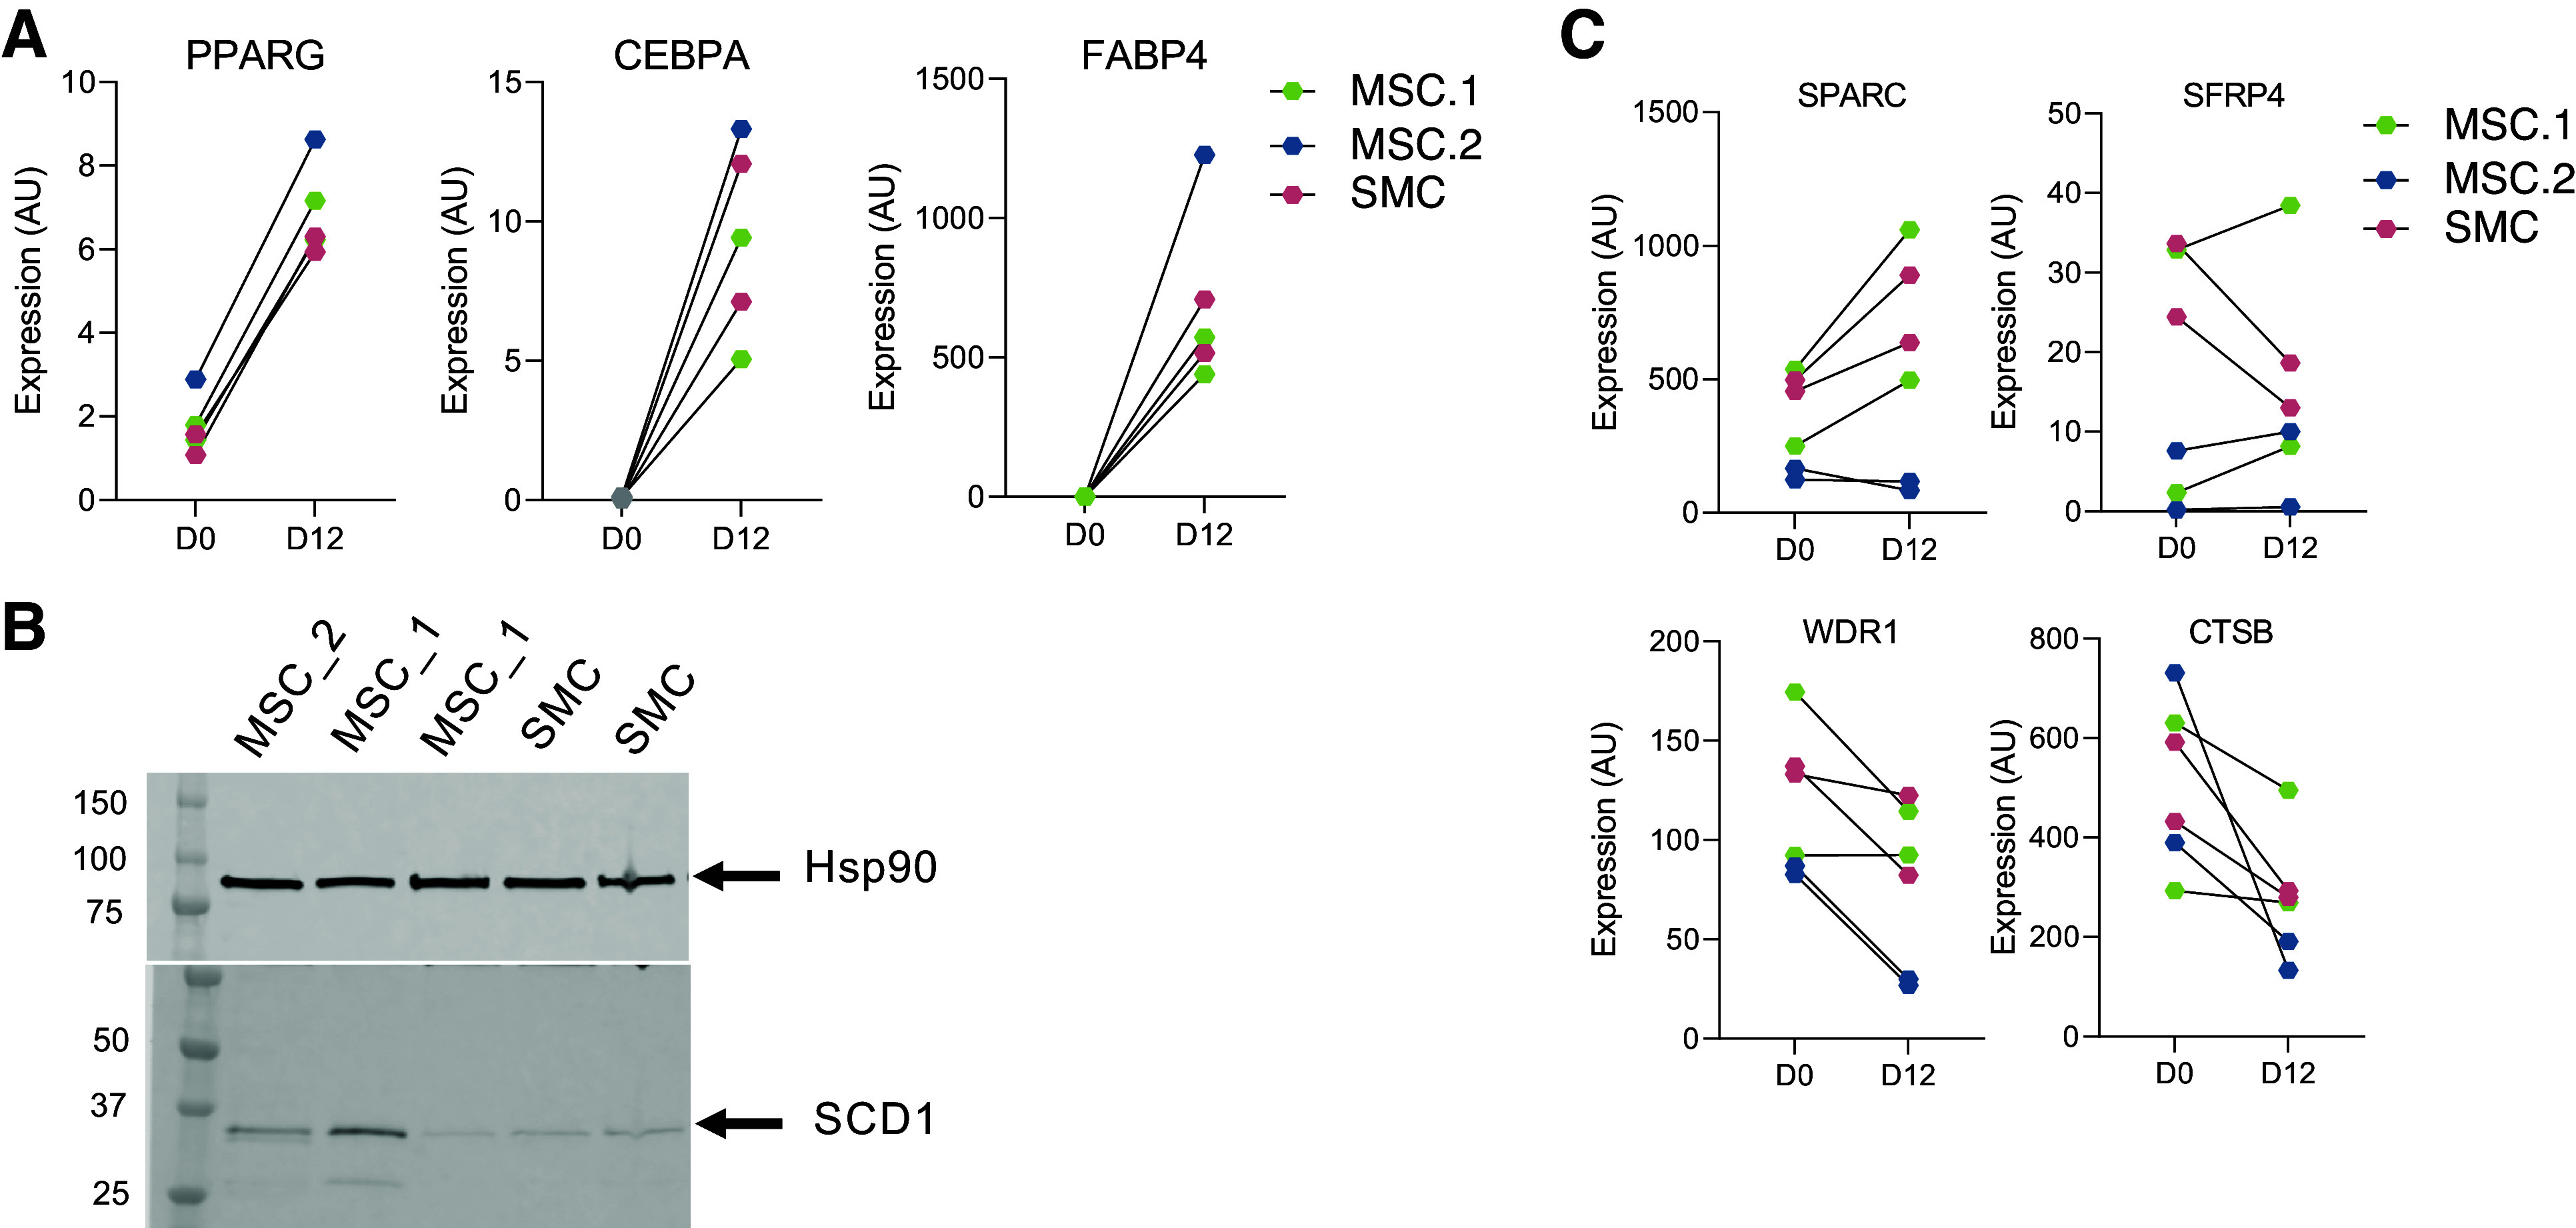
Figure 5.

Validation in vitro of the single-cell (sc)RNA-seq findings. Gene expression levels of adipogenic marker genes before (D0) and after differentiation (D12) in mesenchymal stem cell (MSC)-1, MSC-2 and SMC previously fluorescence-activated cell sorting (FACS) sorted (A). The colors describe the different subpopulations of adipose-derived stem cell (ADSC) isolated by FACS. Lines are drawn connecting values from before and after differentiation. Protein expression levels of adipocyte marker (SCD1) was measured on day 12 of differentiation of MSC-1, MSC-2 and SMC. Hsp90 were used as internal control (B). Gene expression levels of fibrotic and insulin resistant marker genes before (D0) and after differentiation (D12) (C). The colors describe the different subpopulations of ADSC isolated by FACS. Lines are drawn connecting values from before and after differentiation.
