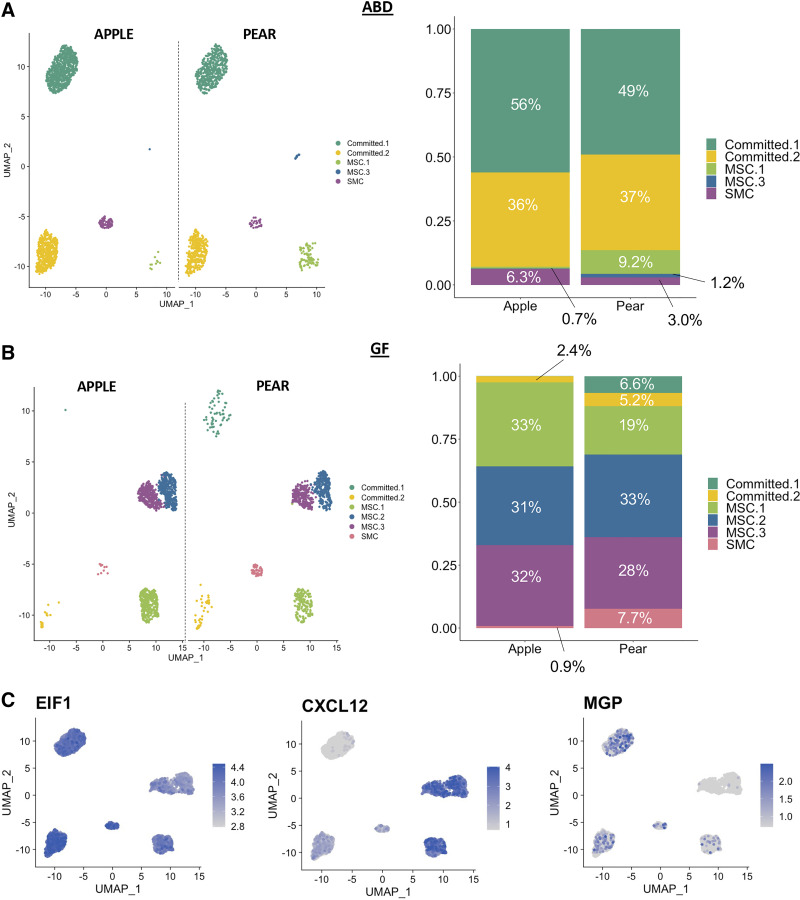
Figure 6.
Adipose-derived stem cell (ADSC) clusters in metabolic conditions. UMAPs and stacked bar-plots showing the repartition of the ADSCs subpopulations according to the body shape (apple vs. pear) in abdominal (ABD) depot (A) and gluteofemoral (GF) depot (B). Feature plot showing expression of EIF1, CXCL12, and MGP genes (C).

