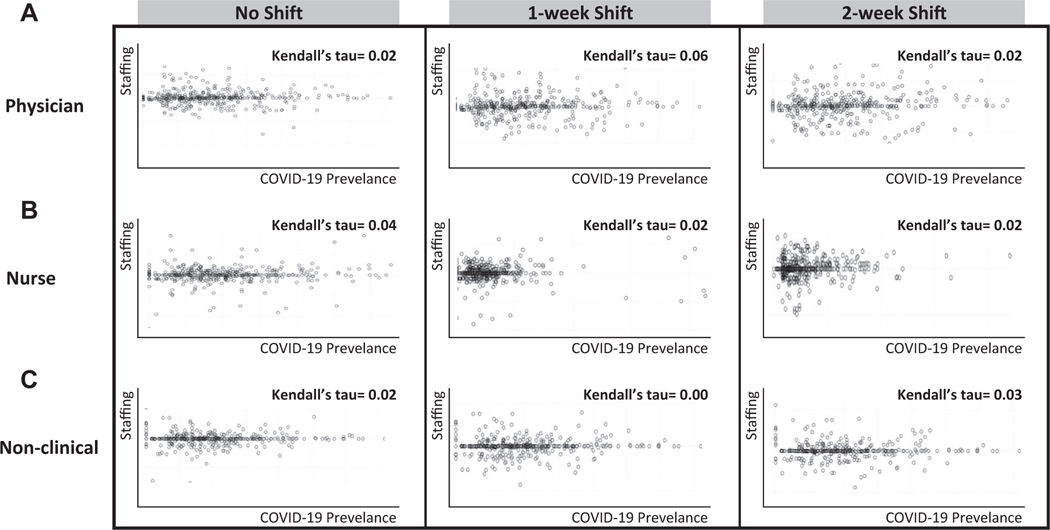
Figure.
A strong association (positive correlation) between staffing and disease will appear as a clustering that moves from lower left of the graph up to the upper right. A negative relationship (negative correlation) will exhibit clustering that moves from the upper left corner of the graph and extends to the lower right corner. Spherical clustering and clustering that extends horizontally across the graph indicate that there is little relationship between staffing and disease burden.

