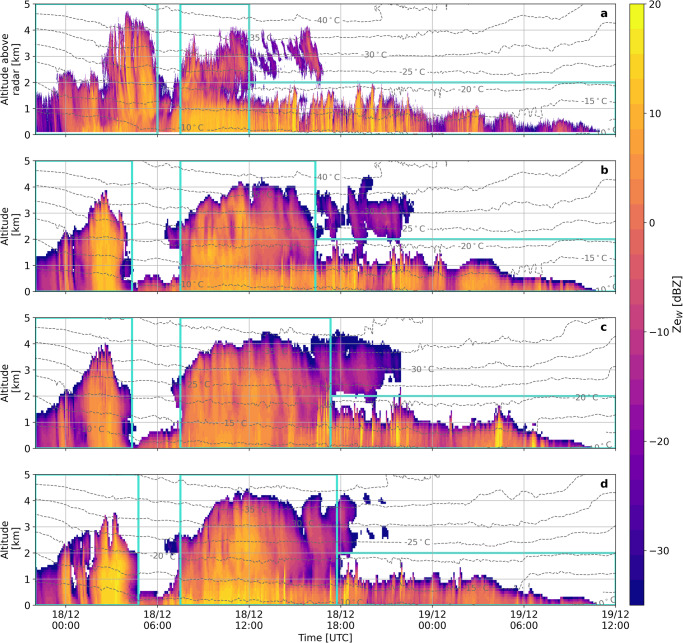
Fig. 1. Comparison between observed and simulated reflectivities.
Time-height plots of radar reflectivity Zew from December 17 (22:00 UTC) to December 19 (12:00 UTC), 2021, displaying (a) measurements by the WProf radar deployed at VL, and simulations coupling the CR-SIM radar simulator with the (b) CONTROL, (c) DEMOTT, and (d) ALLSIP simulations. Turquoise boxes indicate the three distinct cloud periods used to extract statistics. Grey contours in all panels represent temperature isotherms (in °C) from the CONTROL simulation in a and b, and the DEMOTT and ALLSIP simulations in c and d, respectively.

