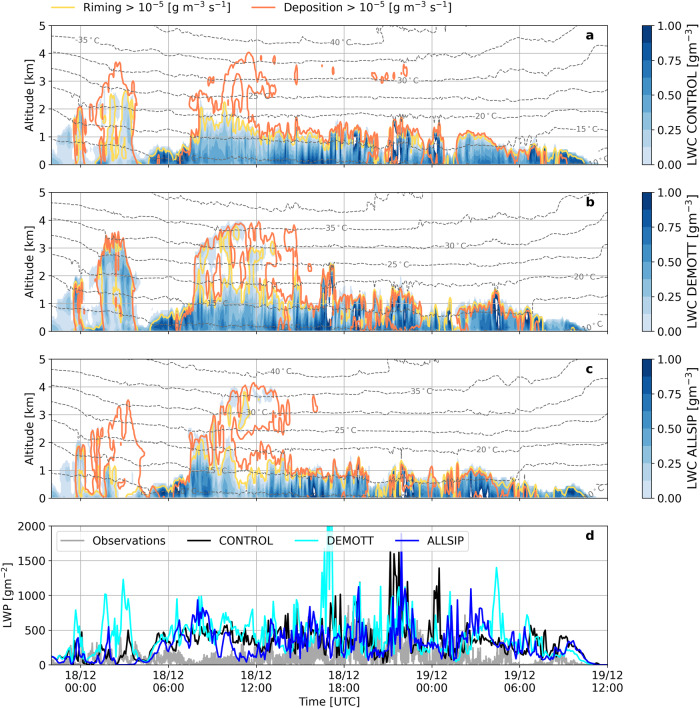
Fig. 3. Liquid water content distributions from simulations and their evaluation against radiometer retrievals.
Time-height plots of total LWC produced by the (a) CONTROL, (b) DEMOTT, and (c) ALLSIP simulations for the period December 17 (22:00 UTC) to December 19 (12:00 UTC), 2021. Grey contour lines represent temperature isotherms (in °C), while yellow (orange) contours delineate areas where riming (vapor deposition) rates exceed 10−5 g m−3 s−1 across all panels. Panel d displays the time series of LWP retrieved at VL from the joint radiometer (grey solid line) and simulated by CONTROL (black line), DEMOTT (cyan line), and ALLSIP (blue line), respectively. Note that the simulated LWP takes into account both cloud droplets and raindrops.

