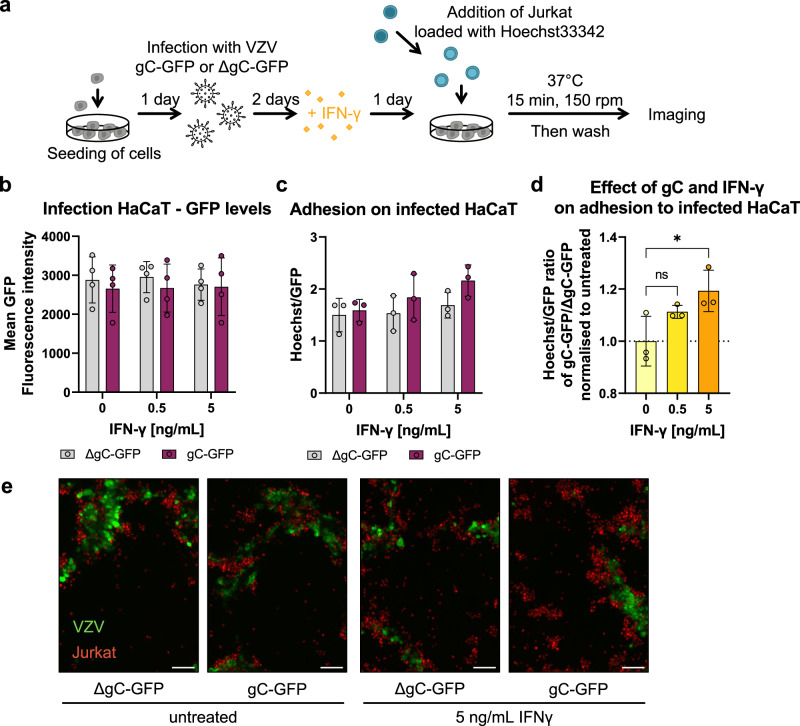
Fig. 6. Jurkat cells adhere better to cells infected with the VZV-gC-GFP virus than with VZV-ΔgC-GFP.
a Schematic representation of the assay. HaCaT cells were seeded 24 h prior to infection with VZV pOka expressing GFP fused to gC (gC-GFP) or expressing GFP instead of gC (ΔgC-GFP). 48 h after infection, the cells were stimulated with IFN-γ or mock-treated. The next day, Hoechst-labelled Jurkat cells were added and allowed to adhere for 15 min at 37 °C on a shaking platform at 150 rpm. Then, non-adhered cells were washed off and two randomly selected regions of interest (ROI) were imaged per well (triplicate per condition) using an automated microscope (Cytation3, BioTek) and the mean Hoechst and GFP intensities were determined. b–d Each circle corresponds to one independent experiment (n = 4 biological experiments in (b) and 3 in (c and d)). Shown are the mean ± SD of the independent experiments. b Graph showing mean GFP fluorescence intensity obtained from HaCaT cells infected with VZV-gC-GFP or VZV-ΔgC-GFP and incubated or not with IFN-γ. c Bar chart showing the amount of adhered Jurkat cells normalised to the amount of infected HaCaT cells (Hoechst/GFP ratio) in the presence or absence of IFN-γ. d Graph showing the Hoechst/GFP ratio from HaCaT cells infected with VZV-gC-GFP divided by that of HaCaT cells infected with VZV-ΔgC-GFP and normalised to the mock-treated condition. Ordinary one-way ANOVA followed by Dunnett’s multiple comparisons test (to test each against a control = no IFN-γ). ns not significant; *P < 0.033; **P < 0.002; ***P < 0.001. Data in b–d are provided as Source Data. e Representative fluorescence microscopy images of Jurkat and HaCaT cells in the four experimental conditions. The GFP signal corresponding to productive infection is depicted in green, whereas the adhered Hoechst positive cells are shown in red. The scale bar corresponds to 100 µm.

