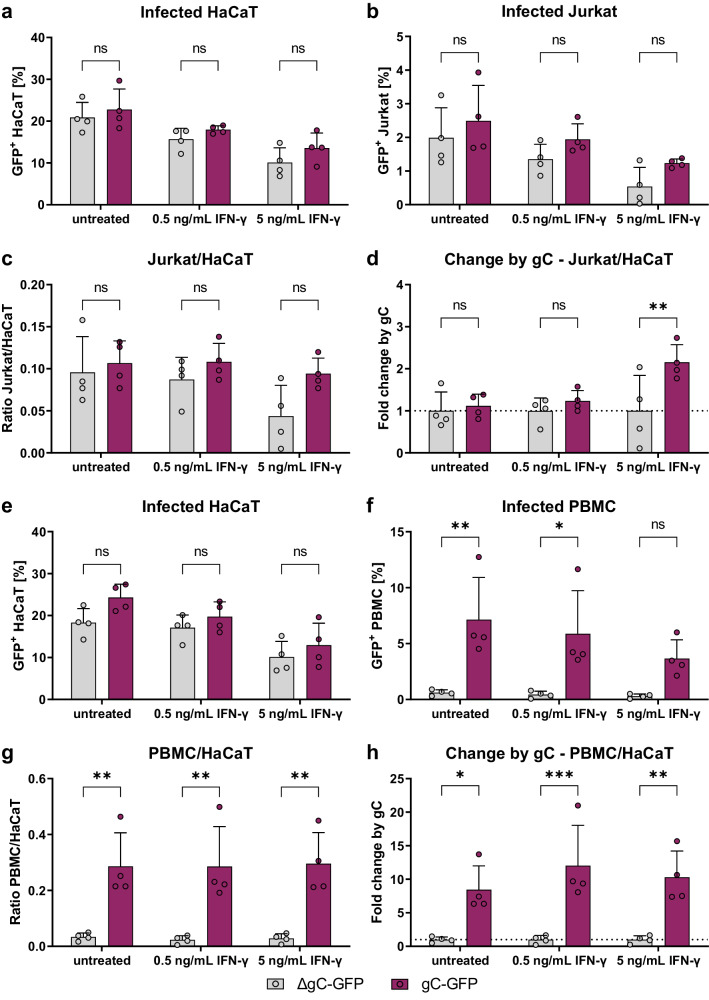
Fig. 7. VZV-gC-GFP spreads more efficiently from HaCaT cells to Jurkat cells and PBMCs than VZV-ΔgC-GFP.
Quantification of infected HaCaT, Jurkat cells and PBMCs by flow cytometry. Each symbol in the graphs (a–h) corresponds to one independent biological experiment (n = 4 biological replicates) depicted as mean ± SD. Magenta indicates cultures infected with VZV-gC-GFP and grey indicates VZV-ΔgC-GFP infected cultures. a, b Percentages of GFP+ HaCaT cells (a) and GFP+ Jurkat cells (b) after co-culture are plotted as bar charts. c Ratio of GFP+ Jurkat cells to GFP+ HaCaT cells is plotted as bar chart. d The fold change attributed to the presence of gC is plotted as a bar chart. e, f Percentages of GFP+ HaCaT cells (e) and GFP+ PBMCs (f) after co-culture are plotted as bar charts. g Ratio of GFP+ PBMCs to GFP HaCaT cells is plotted as bar chart. h The fold change attributed to the presence of gC is plotted as a bar chart. Two-way ANOVA followed by Šídák’s multiple comparisons test (to test between the two viruses) was performed in all experiments. ns not significant; *P < 0.033; **P < 0.002; ***P < 0.001. Data were provided as Source Data.

