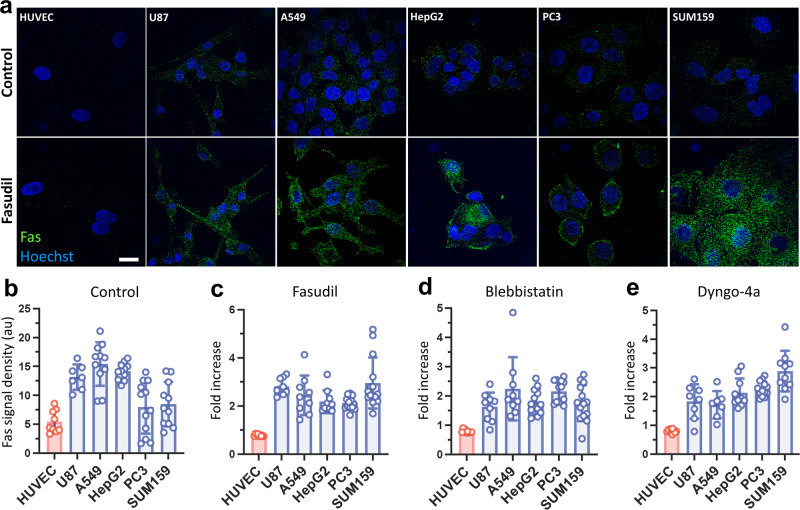
Fig. 2. Inhibition of endocytosis increases Fas microaggregate density on the cell surface.
a Immunofluorescence assays show Fas microaggregate formation on HUVEC cells along with the cancerous U87, A549, HepG2, PC3 and SUM159 cells treated without (upper panel) or with fasudil (lower panel). b The density of the Fas signal is quantified by measuring the integrated microaggregate fluorescence per cell area. Fas signal density is shown for different cells in the absence of endocytosis inhibition. c–e Relative change in Fas signal density is shown for different cells after treatment with 40 µM fasudil (c), 10 µM blebbistatin (d), or 5 µM dyngo-4a (e) for 2 h. Scale bar, 20 µm.

