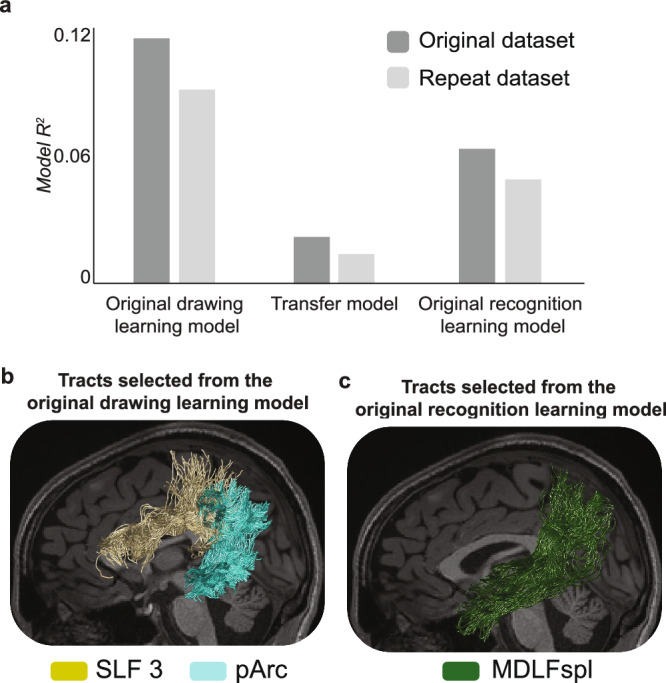
Fig. 3. Associative white matter tracts selectively predict learning.

a Relaxed lasso (RL) regressions were performed to select the group of tracts that best predicted drawing learning and visual recognition learning separately. The bar plot depicts the OLS R2 values for the model selected to predict drawing learning (left) and the model selected to predict visual recognition learning model (right). The bar plot also depicts the OLS R2 values for a transfer model that was constructed to test if the model selected for drawing learning might also predict visual recognition learning. Relative to the original drawing learning model and the original visual recognition learning model, the transfer model was very poor. A Cox test and a J-test both confirmed that the model selected for drawing learning did not transfer to predicting a second learning outcome, i.e., visual recognition learning. b Tracts selected to predict drawing learning, included the left SLF3 and the left pArc. Tracts from one representative participant are displayed. c Tracts selected to predict visual recognition learning included the left MDLF-spl in the original and repeat dataset. Tracts from one representative participant are displayed. We note that the model R2 values depicted in the plot are consistent with the results reported in Table 1; therefore, the R2 value for the original dataset includes both the left MDLFspl and the left temporal-to-parietal connection to the superior parietal lobe (TPC) while the R2 value for the repeat dataset includes only the left MDLFspl. SLF 3: third segment of the superior longitudinal fasciculus, pArc posterior arcuate, MDLFspl middle longitudinal fasciculus connection to the superior parietal lobe.
