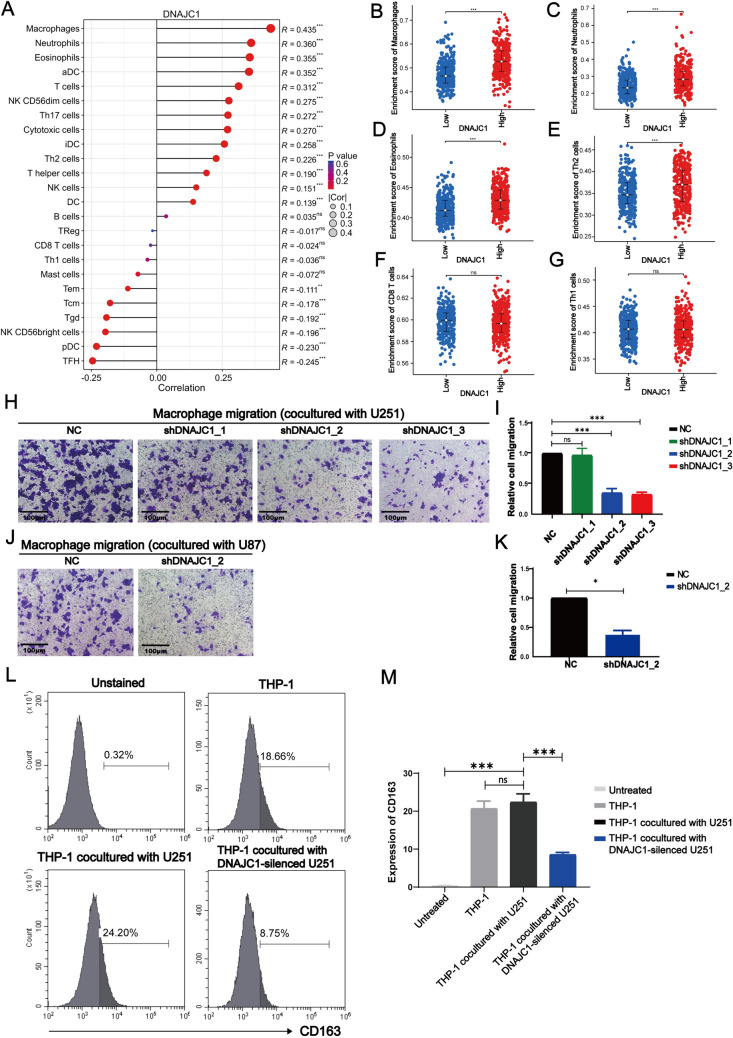
Fig. 6.
Correlation analysis between DNAJC1 expression and macrophage infiltration in GBM. A Correlation between DNAJC1 expression and 24 immune cells. Relationship between DNAJC1 expression level and GBM infiltrating B macrophages, C neutrophils, D Eosinophils, E Th2 cells, F CD8+ T cells, and G Th1 cells. H–K Coculture and recruitment experiments were performed using GBM cells and macrophages. Macrophages, differentiated from THP-1 cells by PMA, were seeded in the upper transwell chambers, while DNAJC1- silencing H,I U251 cells or J,K U87 cells were placed in the lower transwell chambers. Following 24 h of incubation, macrophages that migrated through the chamber membrane were stained with 0.1% crystal violet and counted for statistical analysis. L,M Flow cytometry was employed to analyze the expression of the M2 marker CD163 on macrophages after coculture with DNAJC1-silenced U251 cells or control cells

