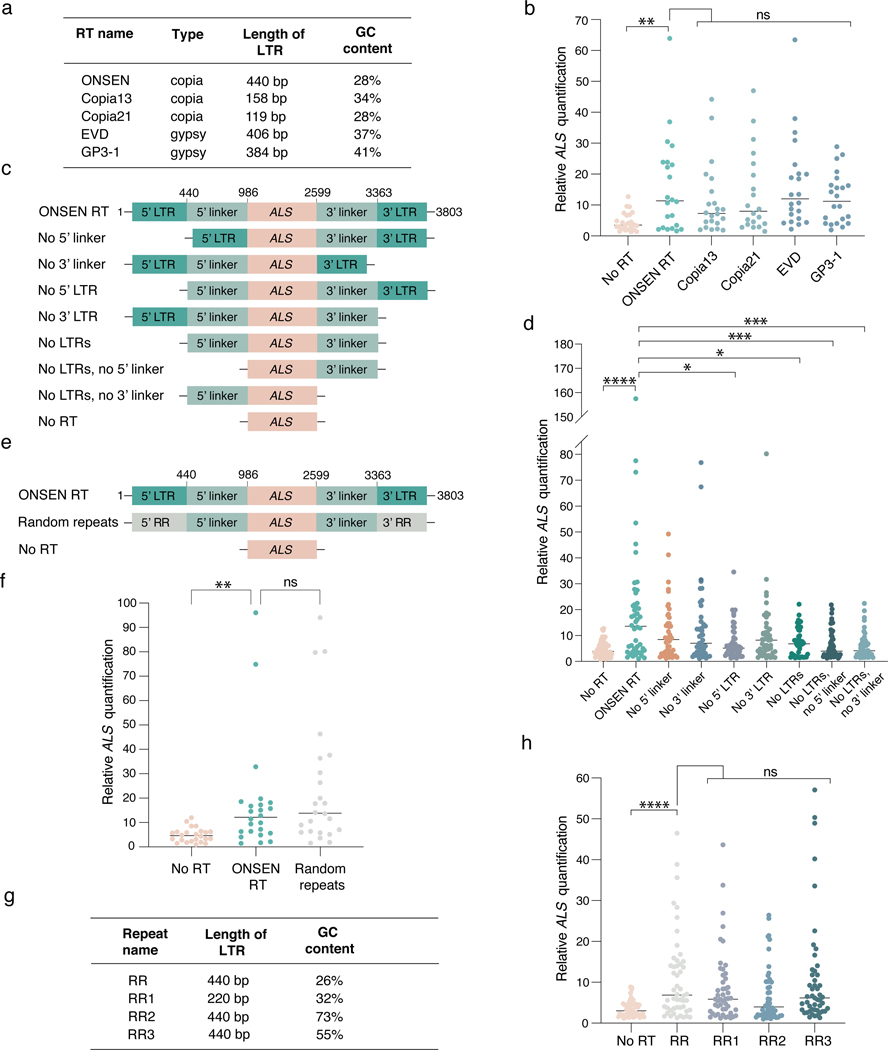
Figure 2. The repetitive nature of LTRs promotes T-DNA concatenation.
a. Classification and characteristics of retrotransposons used to make RT-based T-DNAs. b. DNA-qPCR of ALS in plants transformed using various RT-based plasmids. Each dot represents an individual T1 plant (n = 22). Horizontal bars indicate the median. PNoRT = 0.00639, ns = not significantly different (Kruskal-Wallis ANOVA followed by Dunn’s test). c. Schematic representation of ONSEN deletion constructs used in panel d. d. DNA-qPCR of ALS in plants transformed with ONSEN RT deletion constructs. Each dot represents an individual T1 plant (n = 48). Horizontal bars indicate the median. PNo RT = 0.00001, PNo5’ LTR = 0.00290, PNo LTRs = 0.02991, PNo LTRs, No 5’ linker = 0.00095, PNo LTRs, No 3’ linker = 0.00035 (Kruskal-Wallis ANOVA followed by Dunn’s test). e. Schematic representation of the random repeat construct used in panel f. f. DNA-qPCR of ALS in plants transformed with ONSEN RT and the random repeat construct. Each dot represents an individual T1 plant (n = 24). Horizontal bars indicate the median. PNoRT = 0.00182, ns = not significantly different (Kruskal-Wallis ANOVA followed by Dunn’s test). g. Characteristics of artificial repeat constructs used in panel h. h. DNA-qPCR of ALS in plants transformed using various random repeat-based plasmids. Each dot represents an individual T1 plant (n = 48). Horizontal bars indicate the median. PNoRT = 0.00003, ns = not significantly different (Kruskal-Wallis ANOVA followed by Dunn’s test). ns, P > 0.05; *, P < 0.05; **, P < 0.01; ***, P < 0.001; ****, P < 0.0001.

